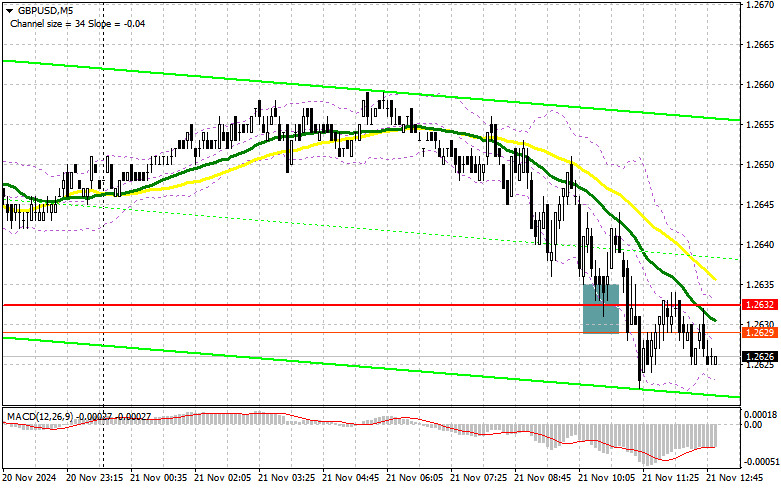
In my morning forecast, I focused on the level of 1.2632 and planned to make decisions regarding market entry at this level. Let us examine the 5-minute chart and analyze the developments. The decline and the formation of a false breakout provided an entry point for buying the pound. However, the pair did not experience significant upward movement. The sellers' advantage remains clear and may persist during the U.S.session. The technical picture has been revised for the second half of the day.
For Opening Long Positions in GBP/USD
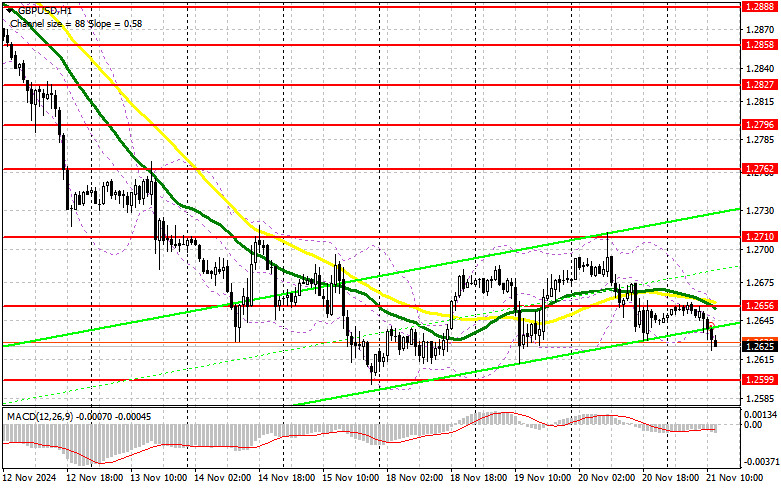
The pound continues to decline, and sellers now clearly have a new target near the monthly low of 1.2599, where I expect the first signs of buyer activity. Strong data on US initial unemployment claims and the Philadelphia Fed manufacturing index may trigger further downward pressure on the pound. Hawkish statements from FOMC members such as Austan D. Goolsbee and Beth M. Hammack could amplify this trend.
Only a decline and the formation of a false breakout at the support level of 1.2599, coinciding with the monthly low, will confirm a valid entry point for long positions. This could lead to a recovery toward the resistance level of 1.2656, formed during the first half of the day. A breakout and retest of this range will create an additional entry point for long positions, with the potential to test 1.2710. The ultimate target for this upward move is the 1.2762 level, where I plan to take profit.
If GBP/USD continues to decline and there is no activity from the bulls at 1.2599, bears may have an opportunity to establish a new trend. In this case, I will consider long positions only after observing a false breakout near the 1.2560 support level. Additionally, I plan to buy GBP/USD on a rebound from the 1.2520 low, targeting an intraday upward correction of 30�35 points.
For Opening Short Positions in GBP/USD
Despite the renewed pressure on the pair, I will avoid rushing into selling at the monthly low. It is more prudent to wait for the pair to rise and observe active bearish action near the resistance level at 1.2656. This level is further reinforced by the presence of moving averages favoring sellers. A false breakout here will provide an opportunity for short positions, targeting a further decline toward the support level at 1.2599.
A breakout and a retest from below this range will likely trigger stop-loss levels, opening the path to a new monthly low of 1.2560. The ultimate target will be the 1.2520 level, where I plan to take profit.
If GBP/USD rises in the second half of the day and ignores the statements from FOMC representatives, pound buyers may attempt to initiate a correction. In such a case, I will delay selling until the pair tests the resistance level at 1.2710. I will consider short positions again only after observing an unsuccessful breakout. Additionally, I will look for short positions on a rebound from the 1.2762 level, targeting an intraday correction of 30�35 points.
COT Report (Commitment of Traders) Analysis
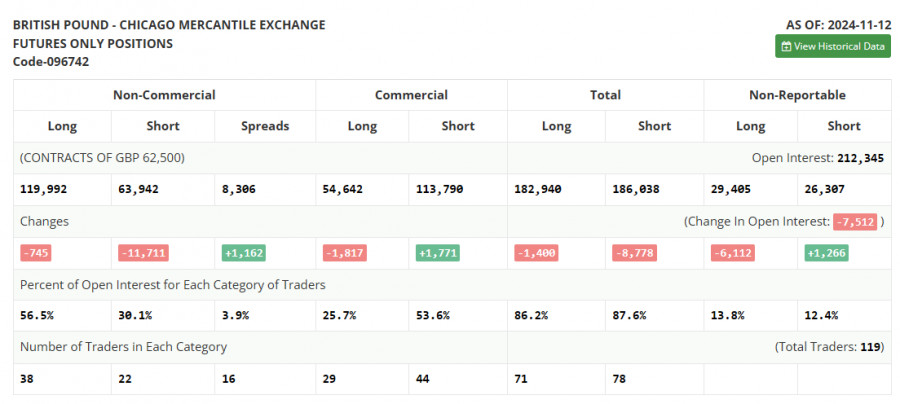
The Commitment of Traders (COT) report for November 12 showed reductions in both long and short positions. These figures already reflect the Bank of England's decision to cut interest rates during its November meeting and developments under Donald Trump's presidency.
The significant reduction in short positions suggests fewer traders are willing to sell at current levels. However, the lack of buying interest limits any chance of a strong correction in the pound. Recent weak GDP data for the UK further reduces the incentive to purchase the pound. According to the latest COT report, non-commercial long positions decreased by 745 to 119,992, while short positions dropped by 11,711 to 63,942. Consequently, the gap between long and short positions widened by 1,162.
Indicator Signals
Moving Averages:Trading is occurring below the 30- and 50-day moving averages, signaling further pressure on the pair.
Note: The periods and prices of moving averages are analyzed on the H1 hourly chart and differ from the conventional definitions of daily moving averages on the D1 daily chart.
Bollinger Bands:In case of a decline, the lower boundary of the indicator near 1.2640 will act as support.
Description of Indicators
- Moving Average: Determines the current trend by smoothing volatility and noise.
- Period � 50 (yellow line on the chart)
- Period � 30 (green line on the chart)
- MACD (Moving Average Convergence/Divergence): Measures the relationship between two moving averages.
- Fast EMA: period 12
- Slow EMA: period 26
- SMA: period 9
- Bollinger Bands: Identifies volatility and potential reversal zones.
- Non-commercial traders: Speculators such as individual traders, hedge funds, and large institutions using the futures market for speculative purposes.
- Long non-commercial positions: Represent the total long open positions held by non-commercial traders.
- Short non-commercial positions: Represent the total short open positions held by non-commercial traders.
- Net non-commercial position: The difference between short and long positions held by non-commercial traders.


