empty
06.11.2023 06:29 AM
BITCOIN: Technical analysis of the situation

Bitcoin

This image is no longer relevant

Higher timeframes

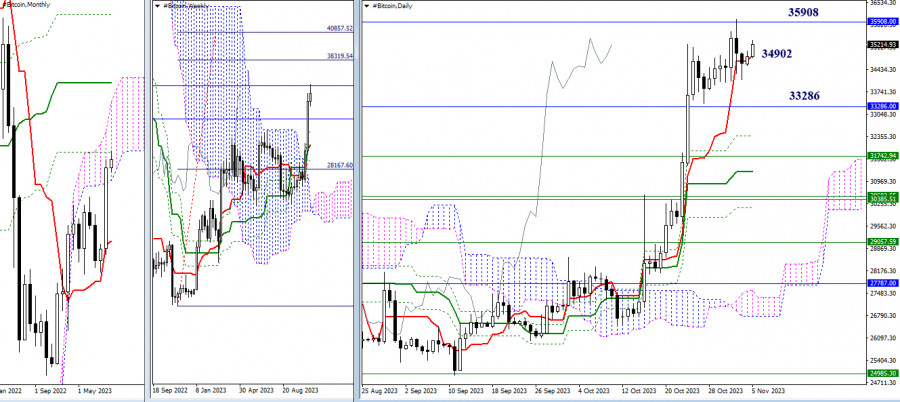
October provided bulls with moments of optimism, pushing the market away from the support of the monthly short-term trend towards the next resistance of the monthly death cross (35,908). Meanwhile, Bitcoin managed to close October within the monthly cloud (33,286), making the upper boundary of the Ichimoku cloud (40,490) the next upward target on this timeframe.

The result of October's activity was also the formation of an upward target for breaking the weekly cloud (38,320 - 40,858). These target levels (38,320 - 40,490 - 40,858) have been planned by the bullish players for November following the optimism and activity of October. This will only be possible if the bulls maintain and continue the October sentiment.

If priorities change and the bears return to the market. In that case, their focus will first be on exiting the monthly cloud (33,286) and then testing and liquidating the existing golden crosses of Ichimoku on the weekly and daily timeframes. The nearest supports from the golden crosses of Ichimoku at the moment can be noted at 32,380 - 31,743 - 31,261.

This image is no longer relevant

H4 - H1

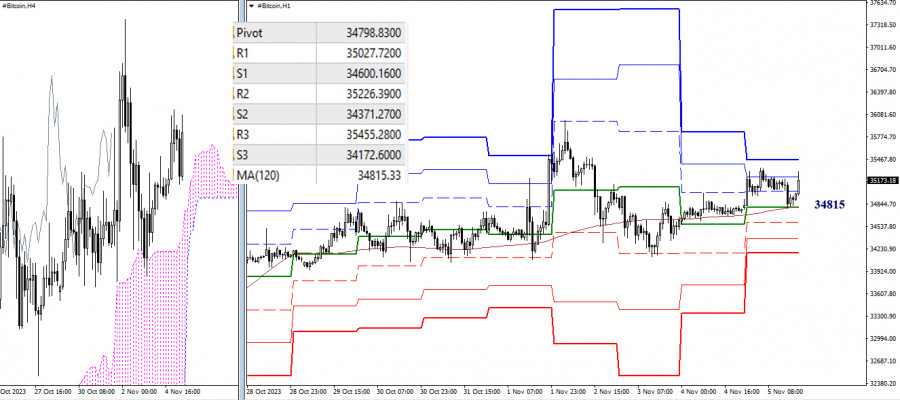
As of writing, the main advantage on the lower timeframes remains with the bullish players. However, the balance of power is very fragile because the weekly long-term trend (34,815) has been acting as support for a long time, responsible for the distribution and balance of power. Bitcoin can lose this support at any moment, after which the market's attention will shift within the day to the supports of the classic pivot points. The primary priority in this case will be the strengthening of bearish sentiments.

Note that the loss of the key level of the lower timeframes—34,815 (weekly long-term trend), is currently associated with losing the center of attraction of the daily timeframe—34,902 (short-term trend). A secure consolidation below 34,902 - 34,815 opens up new prospects for bears, both within the day and on the higher timeframes.

***

The technical analysis of the situation uses:

Higher timeframes - Ichimoku Kinko Hyo (9.26.52) + Fibo Kijun levels

H1 - Pivot Points (classic) + Moving Average 120 (weekly long-term trend)

เลือกช่วงเวลา
5
นาที
15
นาที
30
นาที
1
ชั่วโมง
4
ชั่วโมง
1
วัน
1
สัปดาห์
รับผลกำไรจากการเปลี่ยนแปลงอัตราสกุลเงินดิจิทัลกับ InstaForex.
ดาวน์โหลด MetaTrader 4 และเปิดการซื้อขายครั้งแรกของคุณ.
  • Grand Choice
    Contest by
    InstaForex
    InstaForex always strives to help you
    fulfill your biggest dreams.
    เข้าร่วมการแข่งขัน


บทความแนะนำ

สัญญาณการซื้อขายสำหรับ BITCOIN ประจำวันที่ 15-19 พฤษภาคม 2025: ขายต่ำกว่า $103,600 (+1/8 Murray - 21 SMA)

ในช่วงเช้าของอเมริกา Bitcoin กำลังซื้อขายอยู่ที่ประมาณ 102,746 ซึ่งอยู่ต่ำกว่า 21 SMA และต่ำกว่าระดับ +1/8 Murray เป็นการบ่งบอกถึงสัญญาณการสิ้นสุดพลังงาน Bitcoin กำลังซื้อขายอยู่ในช่องแนวโน้มขาลง การฟื้นตัวครั้งนี้ที่อาจเห็นในชั่วโมงที่ผ่านมาอาจเผชิญกับแรงต้านที่แข็งแกร่งประมาณ 103,213

Dimitrios Zappas 16:51 2025-05-15 UTC+2

สัญญาณการซื้อขายทองคำสำหรับวันที่ 15-19 พฤษภาคม 2025: ซื้อเมื่อราคาสูงกว่า $3,222 หรือขายเมื่อราคาต่ำกว่า $3,203 (200 EMA - 5/8 Murray)

ในช่วงต้นของการซื้อขายในสหรัฐฯ ทองคำมีการซื้อขายอยู่ที่ประมาณ 3,195 ต่ำกว่าระดับ 5/8 ของเส้นมารเรย์ และอยู่ต่ำกว่าค่าเฉลี่ยเคลื่อนที่ระยะยาว 200 วัน (200 EMA) และค่าเฉลี่ยเคลื่อนที่ระยะสั้น 21 วัน (21

Dimitrios Zappas 16:50 2025-05-15 UTC+2

การคาดการณ์ค่าเงิน Forex วันที่ 15/05/2025: EUR/USD, GBP/USD, น้ำมัน และ Bitcoin

ลิงก์ที่เป็นประโยชน์: บทความอื่น ๆ ของฉันสามารถอ่านได้ในส่วนนี้ คอร์ส InstaForex สำหรับผู้เริ่มต้น การวิเคราะห์ที่ได้รับความนิยม เปิดบัญชีซื้อขาย ข้อสำคัญ: ผู้เริ่มต้นในการซื้อขายฟอเร็กซ์จำเป็นต้องระมัดระวังอย่างมากเมื่อทำการตัดสินใจเกี่ยวกับการเข้าสู่ตลาด ก่อนการเปิดเผยรายงานสำคัญ ควรหลีกเลี่ยงการเข้าสู่ตลาดเพื่อป้องกันการตกเป็นเป้าหมายของการผันผวนที่รุนแรงเนื่องจากความผันผวนที่เพิ่มขึ้น หากคุณตัดสินใจทำการซื้อขายในช่วงที่มีการเผยแพร่ข่าว ควรตั้งคำสั่งหยุดเงินเพื่อจำกัดการสูญเสียเสมอ

Sebastian Seliga 11:22 2025-05-15 UTC+2

การคาดการณ์สำหรับ EUR/USD วันที่ 15 พฤษภาคม 2025

ในวันพุธ คู่เงิน EUR/USD ได้ปรับตัวขึ้นสู่แนวต้านบริเวณ 1.1265–1.1282 จากนั้นก็พลิกกลับไปในทิศทางที่เป็นประโยชน์ต่อดอลลาร์สหรัฐ ซึ่งสามารถเพิ่มขึ้นได้ประมาณ 80 จุดภายในสิ้นวัน จุดนี้การเพิ่มขึ้นของดอลลาร์นั้นถือว่าเป็นเหตุการณ์ที่น่ายินดีอยู่แล้ว แต่เทรดเดอร์ยังคงไม่กล้าลงทุนในดอลลาร์สหรัฐ เนื่องจาก "ปัจจัยของทรัมป์" ยังคงมีผลกระทบอยู่ กล่าวคือ

Samir Klishi 11:00 2025-05-15 UTC+2

การคาดการณ์ค่าเงิน GBP/USD สำหรับวันที่ 15 พฤษภาคม 2025

ในกราฟรายชั่วโมงของคู่เงิน GBP/USD เมื่อวันพุธที่ผ่านมา ค่าเงินขึ้นมาถึงโซนแนวต้านที่ระดับ 1.3344–1.3357 แล้วเริ่มปรับลงสู่ระดับ 100.0% Fibonacci ที่ 1.3205 จนถึงเช้าวันพฤหัสบดี คู่เงินดังกล่าวซื้อขายอยู่ในช่วงระหว่าง 1.3205 ถึง 1.3344

Samir Klishi 10:56 2025-05-15 UTC+2

การวิเคราะห์ทางเทคนิคของการเคลื่อนไหวราคาประจำวันของคู่สกุลเงินแปลกใหม่ USD/IDR, วันพฤหัสบดีที่ 15 พฤษภาคม 2025

จากสิ่งที่เห็นในกราฟรายวัน คู่สกุลเงิน Exotic USD/IDR ดูเหมือนจะมีรูปแบบ Bearish 123 ตามด้วยการปรากฏของ Bearish Ross Hook (RH) สองจุด ซึ่งบ่งชี้ว่าสกุลเงินดอลลาร์สหรัฐเริ่มอ่อนค่าลงเมื่อเทียบกับสกุลเงิน Garuda

Arief Makmur 06:46 2025-05-15 UTC+2

การวิเคราะห์ทางเทคนิคของการเคลื่อนไหวของราคาในวันเดียวของดัชนี Nasdaq 100, วันพฤหัสบดีที่ 15 พฤษภาคม 2025

เมื่อเราพิจารณากราฟ 4 ชั่วโมงของดัชนี Nasdaq 100 ซึ่งกำลังเคลื่อนที่เหนือ WMA (21) ที่มีแนวโน้มสูงขึ้น แสดงให้เห็นว่าขณะนี้ฝั่งผู้ซื้อยังคงมีความได้เปรียบอย่างมาก ดังนั้นในอนาคตอันใกล้นี้ #NDX มีโอกาสที่จะเสริมความแข็งแกร่งต่อไปที่ระดับ 21338.7 หากสามารถทำลายระดับนี้และปิดตัวสูงกว่าได้สำเร็จ

Arief Makmur 06:46 2025-05-15 UTC+2

การพยากรณ์ค่าเงิน EUR/USD สำหรับวันที่ 15 พฤษภาคม 2025

เมื่อวันพุธที่ผ่านมา เงินยูโรสามารถปรับตัวขึ้นไปถึงระดับเป้าหมายที่ 1.1266 (ซึ่งเป็นจุดต่ำสุดเมื่อวันที่ 15 เมษายน และ 1 พฤษภาคม) แต่เนื่องจากขาดการสนับสนุนจากภายนอก (ดัชนี S&P 500 เพิ่มขึ้น 0.10%

Laurie Bailey 04:40 2025-05-15 UTC+2

การคาดการณ์ค่าเงิน GBP/USD สำหรับวันที่ 15 พฤษภาคม 2025

เงินปอนด์อังกฤษประสบปัญหาในการทะลุผ่านแนวต้านที่ระดับ 1.3311 เมื่อปิดตลาดรายวัน ในบริบทปัจจุบัน ระดับนี้สอดคล้องกับเส้นศูนย์ (กลาง) ของตัวชี้วัด Marlin ในกรอบรายวัน น่าสนใจที่สายสัญญาณของออสซิลเลเตอร์ได้สร้างรูปแบบกราฟ "หัวและไหล่กลับหัว" (เน้นโดยสี่เหลี่ยมสีเทา) ด้วยเหตุนี้ เราคาดว่าจะเกิดการทะลุผ่านระดับ 1.3311

Laurie Bailey 04:40 2025-05-15 UTC+2

การพยากรณ์ USD/JPY สำหรับวันที่ 15 พฤษภาคม 2025

เมื่อสิ้นสุดการซื้อขายของเมื่อวาน คู่สกุลเงิน USD/JPY ลดลง 73 pips ทดสอบเส้นอินดิเคเตอร์ MACD ด้วยเงาล่าง เป็นที่ชัดเจนว่ามีความพยายามที่จะสร้างฐานในช่วง 145.08–145.91 แต่ความพยายามยังเร็วเกินไปเนื่องจากมีเส้น MACD อยู่ในช่วงนี้ ภายในประมาณ

Laurie Bailey 04:40 2025-05-15 UTC+2
หากไม่สะดวกคุยในตอนนี้
ระบุคำถามไว้ได้ใน แชท.
Widget callback
 

Dear visitor,

Your IP address shows that you are currently located in the USA. If you are a resident of the United States, you are prohibited from using the services of InstaFintech Group including online trading, online transfers, deposit/withdrawal of funds, etc.

If you think you are seeing this message by mistake and your location is not the US, kindly proceed to the website. Otherwise, you must leave the website in order to comply with government restrictions.

Why does your IP address show your location as the USA?

  • - you are using a VPN provided by a hosting company based in the United States;
  • - your IP does not have proper WHOIS records;
  • - an error occurred in the WHOIS geolocation database.

Please confirm whether you are a US resident or not by clicking the relevant button below. If you choose the wrong option, being a US resident, you will not be able to open an account with InstaForex anyway.

We are sorry for any inconvenience caused by this message.