signal strength 3 of 5
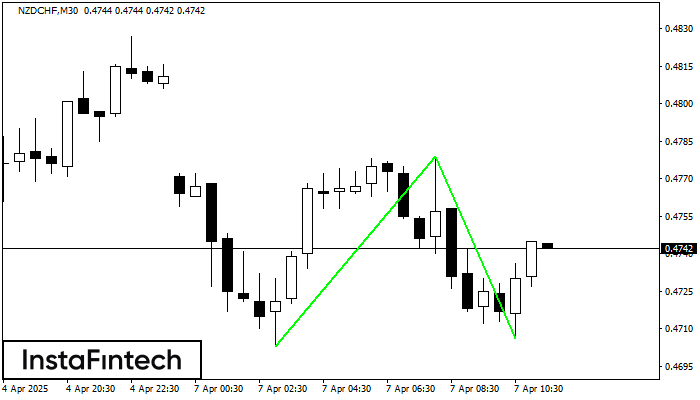
The Double Bottom pattern has been formed on NZDCHF M30. This formation signals a reversal of the trend from downwards to upwards. The signal is that a buy trade should be opened after the upper boundary of the pattern 0.4779 is broken. The further movements will rely on the width of the current pattern 76 points.
Vea asimismo
- All
- Double Top
- Flag
- Head and Shoulders
- Pennant
- Rectangle
- Triangle
- Triple top
- All
- #AAPL
- #AMZN
- #Bitcoin
- #EBAY
- #FB
- #GOOG
- #INTC
- #KO
- #MA
- #MCD
- #MSFT
- #NTDOY
- #PEP
- #TSLA
- #TWTR
- AUDCAD
- AUDCHF
- AUDJPY
- AUDUSD
- EURCAD
- EURCHF
- EURGBP
- EURJPY
- EURNZD
- EURRUB
- EURUSD
- GBPAUD
- GBPCHF
- GBPJPY
- GBPUSD
- GOLD
- NZDCAD
- NZDCHF
- NZDJPY
- NZDUSD
- SILVER
- USDCAD
- USDCHF
- USDJPY
- USDRUB
- All
- M5
- M15
- M30
- H1
- D1
- All
- Buy
- Sale
- All
- 1
- 2
- 3
- 4
- 5

El patrón Triple Piso ha sido formado en #KO M5. Este tiene las siguientes características: nivel de resistencia 71.64/71.57; nivel de soporte 71.39/71.35; el ancho es 25 puntos. En caso
Los marcos de tiempo M5 y M15 pueden tener más puntos de entrada falsos.
Open chart in a new window
Según M5, NZDCAD está formando el patrón técnico: el Cabeza y Hombros Inverso. En caso de que la línea de cuello 0.8179/0.8176 se rompa, es posible que el instrumento
Los marcos de tiempo M5 y M15 pueden tener más puntos de entrada falsos.
Open chart in a new window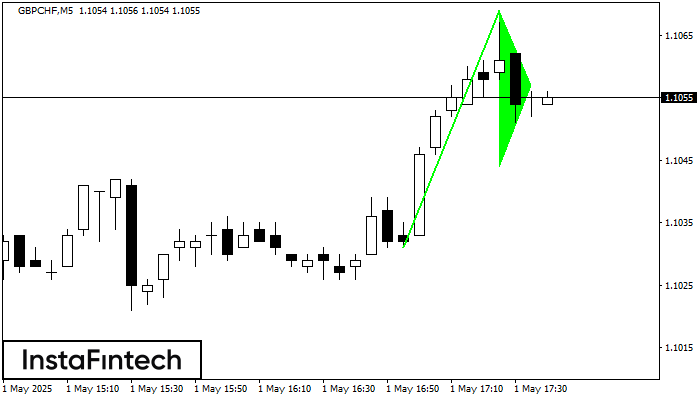
La señal Banderín alcista – Instrumento de negociación GBPCHF M5, patrón de continuación. Pronóstico: es posible establecer una posición de compra por encima del alza del patrón de 1.1069
Los marcos de tiempo M5 y M15 pueden tener más puntos de entrada falsos.
Open chart in a new window