empty
20.01.2025 04:20 AM
Bitcoin – Technical Analysis

BITCOIN

This image is no longer relevant

Higher Timeframes

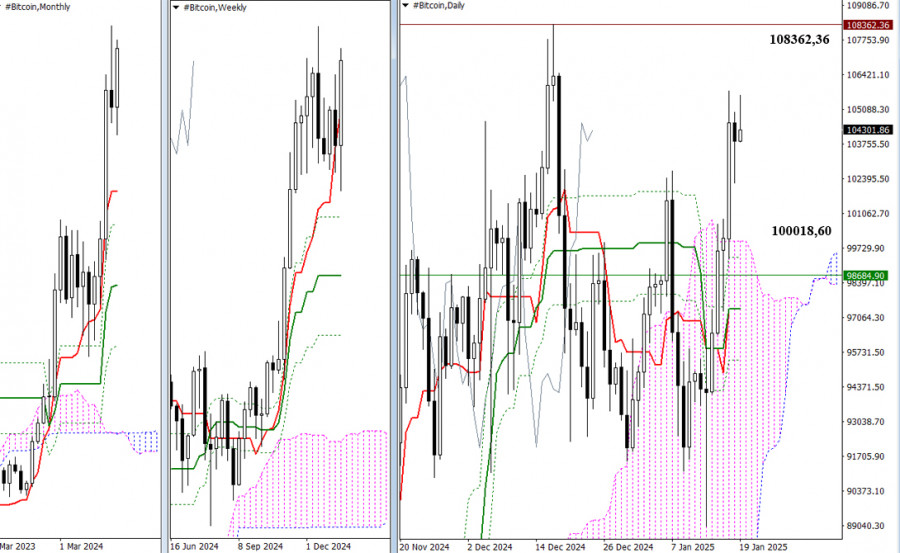
Last year, the bulls clearly had the upper hand, achieving significant advantages and accomplishments. In 2024, they reached a new all-time high of $108,362.36, surpassing the previous peak of $68,959.73 set in 2021. This new high was achieved in December 2024, after which Bitcoin entered a phase of corrective consolidation, trying to explore previously uncharted historical territory.

Currently, the primary target for buyers is the $108,362.36 level, with psychological milestones such as $110,000.00 also becoming a focal point. On the other hand, sellers are concentrating on support levels from various timeframes, which are converging around $100,018.60, $99,375.98, $98,684.90, $97,396.23, and $95,416.47. These levels include the upper boundary of the daily Ichimoku cloud, the weekly short-term trend, and the daily Ichimoku cross.

This image is no longer relevant

H4 – H1

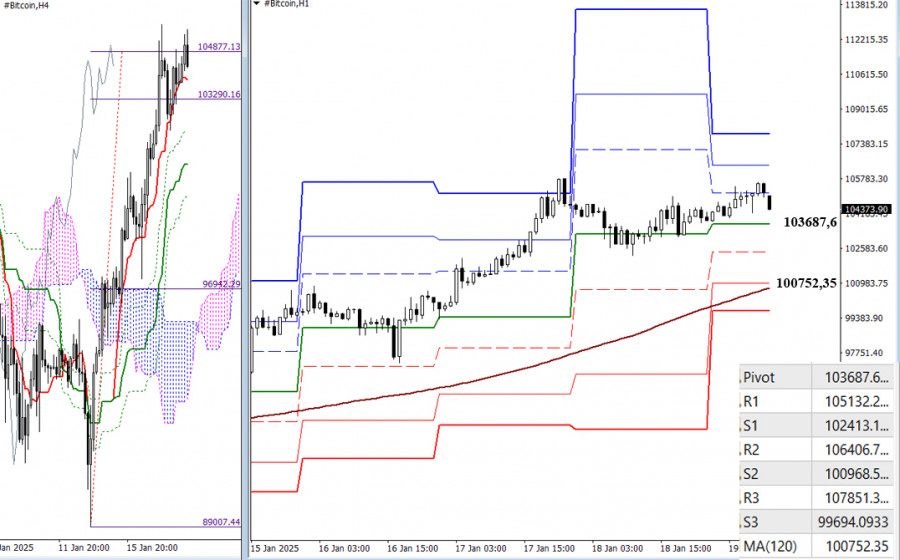
On lower timeframes, buyers currently have the primary advantage. In the most recent upward movement, bulls successfully broke through the H4 Ichimoku cloud at 104,877.13. Although the initial attempt to surpass this level was unsuccessful, Bitcoin entered a corrective decline. Today, bulls are making a second attempt to break above 104,877.13 and continue their ascent.

Intraday bullish targets include R2 at 106,406.76 and R3 at 107,851.39. If there is a pullback, potential support levels based on classic Pivot Points are 103,687.66, 102,413.19, 100,968.56, and 99,694.09, with a long-term weekly trend at 100,752.35.

***

Technical Analysis Components:
  • Higher Timeframes: Ichimoku Kinko Hyo (9.26.52) and Fibonacci Kijun levels
  • H1: Classic Pivot Points and 120-period Moving Average (weekly long-term trend)
Evangelos Poulakis,
Analytical expert of InstaForex
© 2007-2025
Select timeframe
5
min
15
min
30
min
1
hour
4
hours
1
day
1
week
Earn on cryptocurrency rate changes with InstaForex
Download MetaTrader 4 and open your first trade
  • Grand Choice
    Contest by
    InstaForex
    InstaForex always strives to help you
    fulfill your biggest dreams.
    JOIN CONTEST

Recommended Stories

GBP/USD Forecast for May 8, 2025

At today's meeting, the Bank of England is expected to lower the key interest rate from 4.50% to 4.25%. Business media claim the market has already priced in this event

Laurie Bailey 05:09 2025-05-08 UTC+2

USD/JPY Forecast for May 8, 2025

USD/JPY The daily chart shows that the price is reversing downward from the green price channel lines. The first such reversal occurred on May 2, marked by a red arrow

Laurie Bailey 05:09 2025-05-08 UTC+2

GBP/USD. Analysis and Forecast

Today, the GBP/USD pair is pulling back from yesterday's bullish impulse. The retracement is supported by the modest strength of the U.S. dollar. From a technical standpoint, the pair

Irina Yanina 19:28 2025-05-07 UTC+2

Trading Signals for GOLD (XAU/USD) for May 7-9, 2025: buy above $3,360 (21 SMA - 8/8 Murray)

Early in the American session, gold is trading around 3,382, rebounding after reaching a low of 3,359 during the opening session. A strong technical rebound suggests a rally

Dimitrios Zappas 17:49 2025-05-07 UTC+2

Forex forecast 07/05/2025: EUR/USD, USDX, SP500, Gold and Bitcoin

Useful links: My other articles are available in this section InstaForex course for beginners Popular Analytics Open trading account Important: The begginers in forex trading need to be very careful

Sebastian Seliga 11:04 2025-05-07 UTC+2

EUR/USD – May 7th: Bulls Are Reversing the Trend

On Tuesday, the EUR/USD pair reversed in favor of the euro and rose to the resistance zone of 1.1374–1.1383. A rebound from this zone triggered a decline in favor

Samir Klishi 10:56 2025-05-07 UTC+2

GBP/USD – May 7th: Global Uncertainty and the FOMC

On the hourly chart, the GBP/USD pair on Tuesday reversed in favor of the British pound and closed above the resistance zone of 1.3344–1.3357. Therefore, a rebound from this zone

Samir Klishi 10:52 2025-05-07 UTC+2

Technical Analysis of Intraday Price Movement Natural Gas Commodity Instrument, Wednesday May 07, 2025.

On the 4-hour chart, the Natural Gas commodity instrument appears to have a bearish 123 pattern followed by a bearish Ross Hook (RH) plus confirmation that the price movement

Arief Makmur 07:43 2025-05-07 UTC+2

Technical Analysis of Intraday Price Movement of AUD/JPY Cross Currency Pairs, Wednesday May 07, 2025.

If we look at the 4-hour chart of the AUD/JPY cross currency pair, we will see a Descending Broadening Wedge pattern where this pattern gives an indication that

Arief Makmur 07:43 2025-05-07 UTC+2

Trading Signals for EUR/USD for May 6-8, 2025: sell below 1.1370 (200 EMA - 6/8 Murray)

Technically, the euro is exhausted. So, the bearish outlook could remain valid as long as ER/USD settles below 1.1370. It could then reach the 200 EMA located at 1.08

Dimitrios Zappas 17:50 2025-05-06 UTC+2
Can't speak right now?
Ask your question in the chat.
Widget callback
 

Dear visitor,

Your IP address shows that you are currently located in the USA. If you are a resident of the United States, you are prohibited from using the services of InstaFintech Group including online trading, online transfers, deposit/withdrawal of funds, etc.

If you think you are seeing this message by mistake and your location is not the US, kindly proceed to the website. Otherwise, you must leave the website in order to comply with government restrictions.

Why does your IP address show your location as the USA?

  • - you are using a VPN provided by a hosting company based in the United States;
  • - your IP does not have proper WHOIS records;
  • - an error occurred in the WHOIS geolocation database.

Please confirm whether you are a US resident or not by clicking the relevant button below. If you choose the wrong option, being a US resident, you will not be able to open an account with InstaForex anyway.

We are sorry for any inconvenience caused by this message.