empty
31.03.2025 09:07 AM
EUR/USD and GBP/USD March 31 – Technical Analysis

EUR/USD

This image is no longer relevant

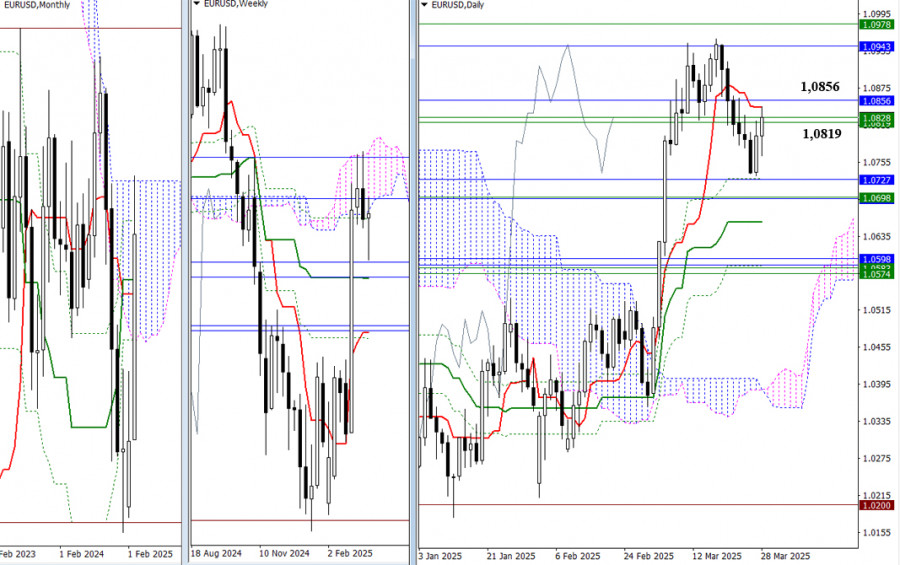
During the week, bearish players attempted to confirm the earlier-formed pullback and continue the decline but were unsuccessful, resulting in a long lower shadow on the weekly candlestick. The pair has returned to the cluster of resistance levels (1.0819–1.0856), which now represents the nearest resistance zone. Under the current conditions, a new phase of consolidation and uncertainty is possible. A firm consolidation above 1.0844–1.0856 would give buyers another opportunity to test the upper boundaries of the weekly (1.0978) and monthly (1.0943) Ichimoku clouds, aiming to break through and enter the bullish zone in terms of Ichimoku cloud analysis. If the current resistances are not broken and bearish players return to the market, the nearest downside targets in this part of the chart are around 1.0698–1.0727 and 1.0574–1.0598.

This image is no longer relevant

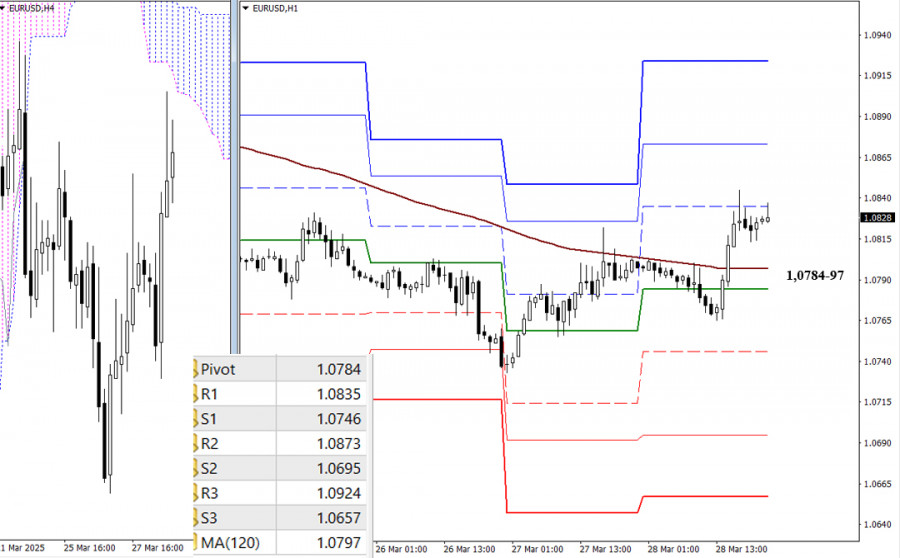
The main advantage currently lies with the bulls on the lower timeframes. If they reverse the weekly long-term trend (1.0797) and continue the upward movement, intraday reference points will be the resistances of the classic Pivot levels. Losing the key levels of 1.0784–1.0797 would affect the current balance of power, and increased bearish sentiment on the lower timeframes would develop through the breakdown of classic Pivot supports. Updated Pivot values will appear when the market opens.

***

GBP/USD

This image is no longer relevant

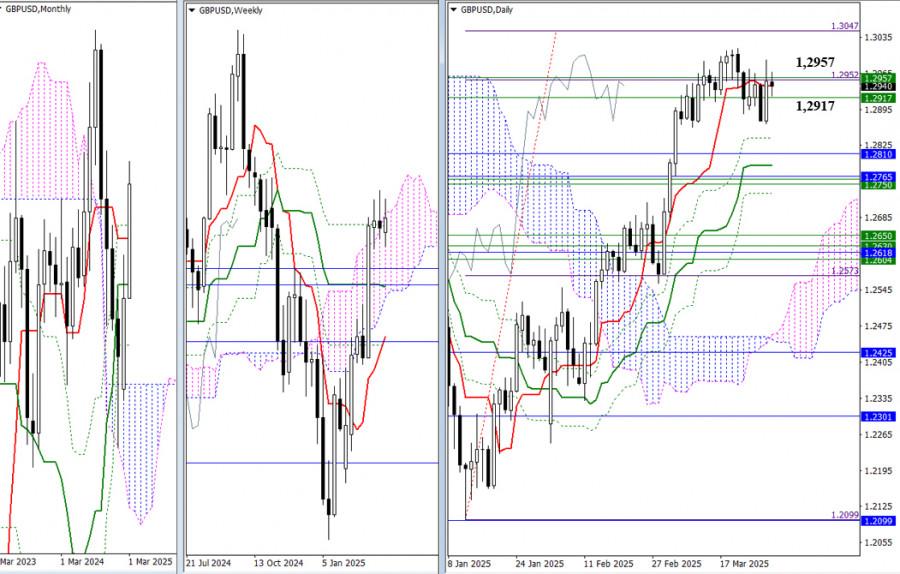
For the third consecutive week, the pound has been unable to exit the zone of uncertainty formed by the convergence of two weekly resistance levels (1.2917–1.2957) and the fulfillment of the daily target to break through the Ichimoku cloud at the first target level (1.2952). As a result, the situation has not significantly changed, and the following reference levels remain in place. For bulls, the nearest goal remains the daily target at 1.3047. Bears, meanwhile, still face a wide support zone that combines levels from multiple timeframes, headed by the monthly short-term trend (1.2765), the weekly medium-term trend (1.2761), and the daily medium-term trend (1.2786).

This image is no longer relevant

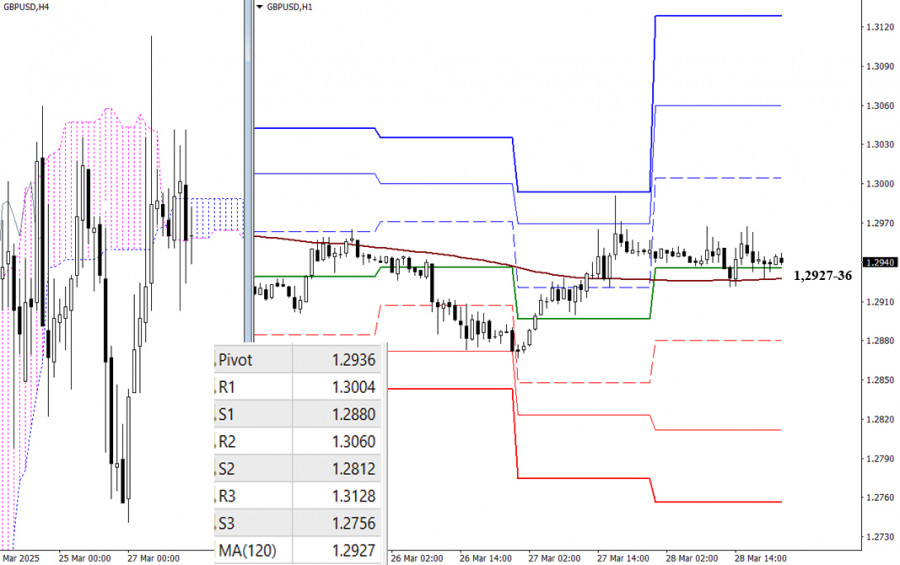
The uncertainty of the higher timeframes is also reflected in the lower timeframes. The pair has been hovering near the key levels of 1.2927–1.2936 (weekly long-term trend + daily central Pivot level) for an extended period. A restraining factor in this area is the influence of the H4 Ichimoku cloud, which is currently positioned almost horizontally. If a directional move forms, intraday reference points will be the support and resistance levels of the classic Pivot Points. New values for these Pivot levels will appear when the market opens.

***

Technical Analysis Components:
  • Higher Timeframes: Ichimoku Kinko Hyo (9.26.52) and Fibonacci Kijun levels
  • H1: Classic Pivot Points and 120-period Moving Average (weekly long-term trend)
Evangelos Poulakis,
انسٹافاریکس کا تجزیاتی ماہر
© 2007-2025
ٹائم فریم منتخب کریں
5
منٹ
15
منٹ
30
منٹ
1
گھنٹہ
4
گھنٹے
1
دن
1
ہفتہ
انسٹافاریکس کے ساتھ کرپٹو کرنسی کی معاملاتی تبدیلیوں سے کمائیں۔
میٹا ٹریڈر 4 ڈاؤن لوڈ کریں اور اپنی پہلی ٹریڈ کھولیں۔
  • Grand Choice
    Contest by
    InstaForex
    InstaForex always strives to help you
    fulfill your biggest dreams.
    مقابلہ میں شامل ہوں

تجویز کردہ مضامین

مئی 13 2025 کو یورو / یو ایس ڈی کی پیشن گوئی

پیر کے روز، یورو / یو ایس ڈی پئیر نے جمعہ کو 1.1265–1.1282 کے مزاحمتی زون سے ری باؤنڈنگ کے بعد اپنی کمی کو جاری رکھا۔ جوڑا 1.1181 پر 127.2%

Samir Klishi 14:15 2025-05-13 UTC+2

13 مئی 2025 کے لیے یورو/امریکی ڈالر کی پیش گوئی

کل کی مرکزی تقریب، جس نے بازاروں کو کسی حد تک الجھا دیا، امریکہ اور چین کے درمیان باہمی محصولات پر واپس جانے کا معاہدہ تھا جو 2 اپریل

Laurie Bailey 13:39 2025-05-13 UTC+2

یورو / یو ایس ڈی: مئی 12۔ یوکرین کا تنازعہ حل ہو سکتا ہے۔

اچھا دن، پیارے تاجروں! جمعہ کو، یورو / یو ایس ڈی جوڑا بڑھ کر 1.1265–1.1282 کے مزاحمتی زون پر پہنچ گیا، ریباؤنڈ ہوا، اور امریکی ڈالر

Samir Klishi 16:09 2025-05-12 UTC+2

جی بی پی / یو ایس ڈی ۔ 12 مئی۔ ٹرمپ کی پہلی تجارتی ڈیل

اچھا دن، پیارے تاجروں! گھنٹہ وار چارٹ پر، جی بی پی / یو ایس ڈی پئیر نے جمعہ کو تقریباً 1.3205 پر 100.0% فیبوناچی ریٹریسمنٹ کی سطح سے ریباؤنڈ مکمل

Samir Klishi 15:56 2025-05-12 UTC+2

مئی 9-12 2025 کے لیے سونے کے لیے تجارتی سگنل: $3,361 سے نیچے فروخت کریں (21 ایس ایم اے - 7/8 مرے)

دوسری طرف، اگر بیئرش (منفی) رجحان غالب آ جاتا ہے، تو ممکن ہے کہ سونا دوبارہ نیچے آ جائے اور ایک بار پھر میورے 6/8 کی سطح کو آزمائے،

Dimitrios Zappas 16:49 2025-05-09 UTC+2

جی بی پی / یو ایس ڈی۔ 8 مئی۔ بینک آف انگلینڈ کی میٹنگ سے قبل تاجر تذبذب کا شکار ہیں

فی گھنٹہ چارٹ پر، بدھ کو جی بی پی / یو ایس ڈی پئیر اپنی اوپر کی حرکت جاری رکھنے میں ناکام رہا۔ راتوں رات، یہ 1.3344–1.3357

Samir Klishi 17:14 2025-05-08 UTC+2

یورو / یو ایس ڈی کی پیش گوئی برائے 08 مئی 2025

بدھ کو، یورو / یو ایس ڈی پئیر دو بار 1.1374–1.1383 کے مزاحمتی زون سے واپس لوٹا، امریکی ڈالر کے حق میں پلٹ گیا، اور 1.1265 پر 100.0% اصلاحی

Samir Klishi 16:45 2025-05-08 UTC+2

جی بی پی / یو ایس ڈی - 7 مئی: عالمی غیر یقینی صورتحال اور ایف او ایم سی

گھنٹہ وار چارٹ پر، منگل کو جی بی پی / یو ایس ڈی پئیر برطانوی پاؤنڈ کے حق میں پلٹ گیا اور 1.3344–1.3357 کے مزاحمتی زون کے اوپر بند ہوا۔

Samir Klishi 19:10 2025-05-07 UTC+2

یورو / یو ایس ڈی - 7 مئی: بُلز رجحان کو تبدیل کر رہے ہیں۔

منگل کو، یورو / یو ایس ڈی جوڑا یورو کے حق میں پلٹ گیا اور 1.1374–1.1383 کے مزاحمتی زون پر پہنچ گیا۔ اس زون سے واپسی نے امریکی ڈالر

Samir Klishi 18:51 2025-05-07 UTC+2

انٹرا ڈے پرائس موومنٹ کروڈ آئل کموڈٹی انسٹرومنٹ کا تکنیکی تجزیہ، منگل 06 مئی 2025۔

قیمتوں کی نقل و حرکت کے ساتھ ہائر لو - لوئر لو اور ڈبلیو ایم اے (30 شفٹ 2) کی گھٹتی ہوئی ڈھلوان اور اس سے نیچے جانے والی

Arief Makmur 17:19 2025-05-06 UTC+2
ابھی فوری بات نہیں کرسکتے ؟
اپنا سوال پوچھیں بذریعہ چیٹ.
Widget callback
 

Dear visitor,

Your IP address shows that you are currently located in the USA. If you are a resident of the United States, you are prohibited from using the services of InstaFintech Group including online trading, online transfers, deposit/withdrawal of funds, etc.

If you think you are seeing this message by mistake and your location is not the US, kindly proceed to the website. Otherwise, you must leave the website in order to comply with government restrictions.

Why does your IP address show your location as the USA?

  • - you are using a VPN provided by a hosting company based in the United States;
  • - your IP does not have proper WHOIS records;
  • - an error occurred in the WHOIS geolocation database.

Please confirm whether you are a US resident or not by clicking the relevant button below. If you choose the wrong option, being a US resident, you will not be able to open an account with InstaForex anyway.

We are sorry for any inconvenience caused by this message.