empty
 
 
30.12.2024 01:23 AM
Gold - Technical Analysis of the Situation

GOLD

This image is no longer relevant

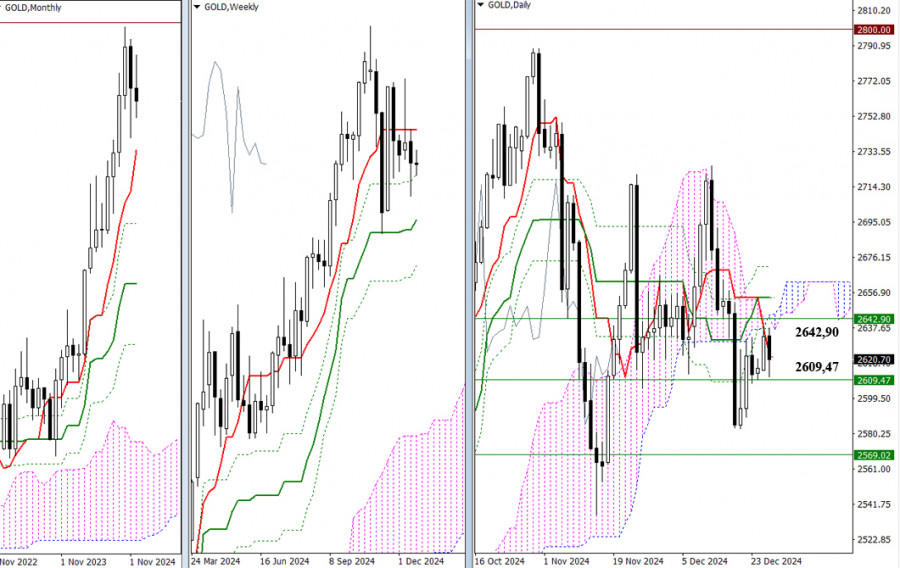
The holiday season continues to impact the market, balancing opportunities and participant activity. Over the past week, the price range has been narrow. Current support is established at the weekly Fibonacci Kijun level of 2609.47, while resistance is marked by the daily cloud at 2637.37. For the last few days, the center of attraction has been the daily short-term trend at 2623.39.

With just two days remaining in December, we are approaching the end of 2024. Significant market activity may remain subdued in the near term and into the first few days of January. Nevertheless, we can identify key levels that traders might consider for any potential directional movements.

The interests of bearish players during the market decline will focus on breaking below the nearest weekly support level at 2609.47, aiming to update the recent low of 2582.84 and test the weekly mid-term trend, which is projected to rise to approximately 2569.02 when trading opens. Currently, bearish players are contending with the resistance posed by the daily cloud, which will be bolstered by the weekly short-term trend at 2642.90 when trading begins on Monday. If there is a breakout and consolidation in the bullish zone relative to the daily cloud, bearish players will also eliminate the daily Ichimoku cross. It is important to note that within a few days, the upper boundary of the cloud will be at the 2662.89 line, while the current cross levels are positioned at 2654.20 and 2671.05.

This image is no longer relevant

H4 – H1

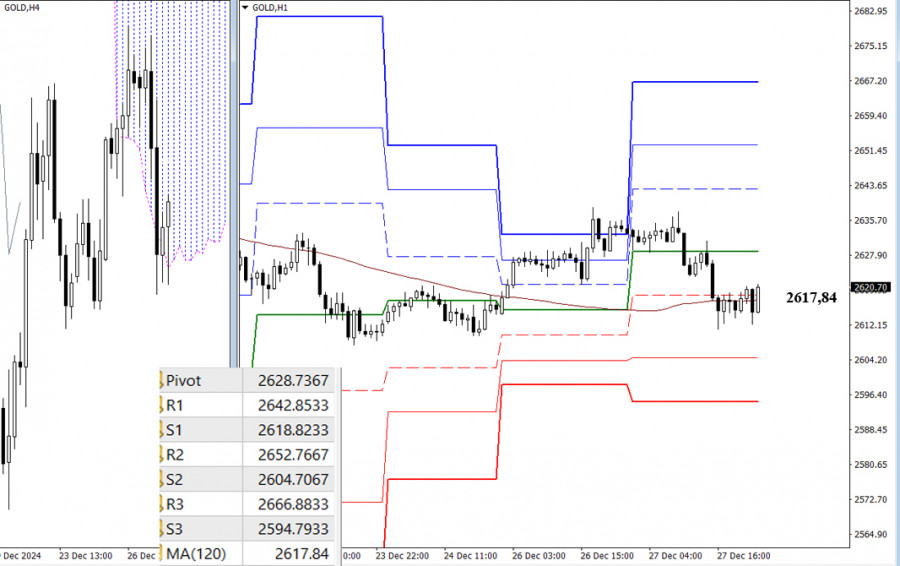
Currently, on lower timeframes, the market is focused around the weekly long-term trend level of 2617.84, which indicates the prevailing balance of power. The bullish advantage remains intact as long as the price stays above this trend. Daily resistance levels from classic Pivot Points serve as potential intraday targets. However, if the price moves below the trend and reverses downward, this could shift the balance in favor of the bears, leading to a continuation of the decline. Intraday bearish targets can be identified through classic Pivot Point support levels.

Pivot Point values are updated daily, and new levels to monitor for the first trading day of the upcoming week will be available upon the market's opening.

***

Technical Analysis Components:
  • Higher Timeframes: Ichimoku Kinko Hyo (9.26.52) + Fibonacci Kijun levels
  • H1: Classic Pivot Points + Moving Average 120 (weekly long-term trend)
Evangelos Poulakis,
انسٹافاریکس کا تجزیاتی ماہر
© 2007-2025
انسٹافاریکس کے ساتھ کرپٹو کرنسی کی معاملاتی تبدیلیوں سے کمائیں۔
میٹا ٹریڈر 4 ڈاؤن لوڈ کریں اور اپنی پہلی ٹریڈ کھولیں۔
  • Grand Choice
    Contest by
    InstaForex
    InstaForex always strives to help you
    fulfill your biggest dreams.
    مقابلہ میں شامل ہوں
  • چانسی ڈیپازٹ
    اپنے اکاؤنٹ میں 3000 ڈالر جمع کروائیں اور حاصل کریں$10000 مزید!
    ہم جنوری قرعہ اندازی کرتے ہیں $10000چانسی ڈیپازٹ نامی مقابلہ کے تحت
    اپنے اکاؤنٹ میں 3000 ڈالر جمع کروانے پر موقع حاصل کریں - اس شرط پر پورا اُترتے ہوئے اس مقابلہ میں شرکت کریں
    مقابلہ میں شامل ہوں
  • ٹریڈ وائز، ون ڈیوائس
    کم از کم 500 ڈالر کے ساتھ اپنے اکاؤنٹ کو ٹاپ اپ کریں، مقابلے کے لیے سائن اپ کریں، اور موبائل ڈیوائسز جیتنے کا موقع حاصل کریں۔
    مقابلہ میں شامل ہوں
  • 100 فیصد بونس
    اپنے ڈپازٹ پر 100 فیصد بونس حاصل کرنے کا آپ کا منفرد موقع
    بونس حاصل کریں
  • 55 فیصد بونس
    اپنے ہر ڈپازٹ پر 55 فیصد بونس کے لیے درخواست دیں
    بونس حاصل کریں
  • 30 فیصد بونس
    ہر بار جب آپ اپنا اکاؤنٹ ٹاپ اپ کریں تو 30 فیصد بونس حاصل کریں
    بونس حاصل کریں

تجویز کردہ مضامین

ابھی فوری بات نہیں کرسکتے ؟
اپنا سوال پوچھیں بذریعہ چیٹ.
Widget callback