


 Williams` Percent Range
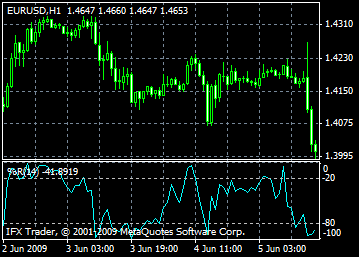
Technical Indicator Williams` Percent Range (%R) is a dynamic indicator, which determines overbought or oversold condition of the market. Williams` Percent Range is and Stochastic Oscillator are very similar. The only difference is that the first one has an upside down scale and the Stochastic Oscillator has internal smoothing.
Indicator values ranging between 80 and 100% show that the market is oversold. Indicator values ranging between 0 and 20% show that the market is overbought. When the indicator is in the upside down scale, its values usually are assigned a minus symbol (for example -30%). During analysis one may ignore the minus symbol.
All overbought/oversold indicators obey one rule: act according to the signal when prices turn happens. For example, if an overbought/oversold indicator shows an overbought condition, it is better to wait until the prices turn down before executing a sell deal.
Williams Percent Range indicator can foreseen prices reversals. The indicator almost always forms a peak and turns in backward direction a few days before the price reaches its peak and goes down. Thus, Williams Percent Range forms a trough and turns up a few days before the price goes up.
Calculation
TBelow is the formula of the %R indicator calculation, which is very similar to the Stochastic Oscillator formula: %R = (HIGH(i-n)-CLOSE)/(HIGH(i-n)-LOW(i-n))*100
Where:
CLOSE - is today`s closing price;
HIGH(i-n) - is the highest high over a number (n) of previous periods;
LOW(i-n) - is the lowest low over a number (n) of previous periods.

The InstaForex Analyst Team
GK InstaFintech © 2007-2026


Watch webinars
Forex webinar or interactive seminar is a modern and easily available way of learning how to trade Forex online. It is suitable for both novice and savvy investors
Watch webinars
Download InstaForex training course for beginners
Have you just started learning things about Forex? Don't miss our offer! Open a trading account and get the opportunity to download a ready-made training course created by InstaForex professional FX strategists
Download training course
Learn forex trading with tutor
The main training course includes 3 free lessons where our forex expert will tell you how to make accurate trading decisions and help you hone your practice skills
Learn more
InstaForex workshops
Register for workshops on topics which you are most interested in. They are available in online and offline formats. Our professional tutors will organize a thorough discussion of the chosen topics and will explain the most difficult things in a causal language
Learn more

