empty
26.03.2025 03:40 AM
Trading Recommendations and Analysis for GBP/USD on March 26: The Pound Continues to Swing

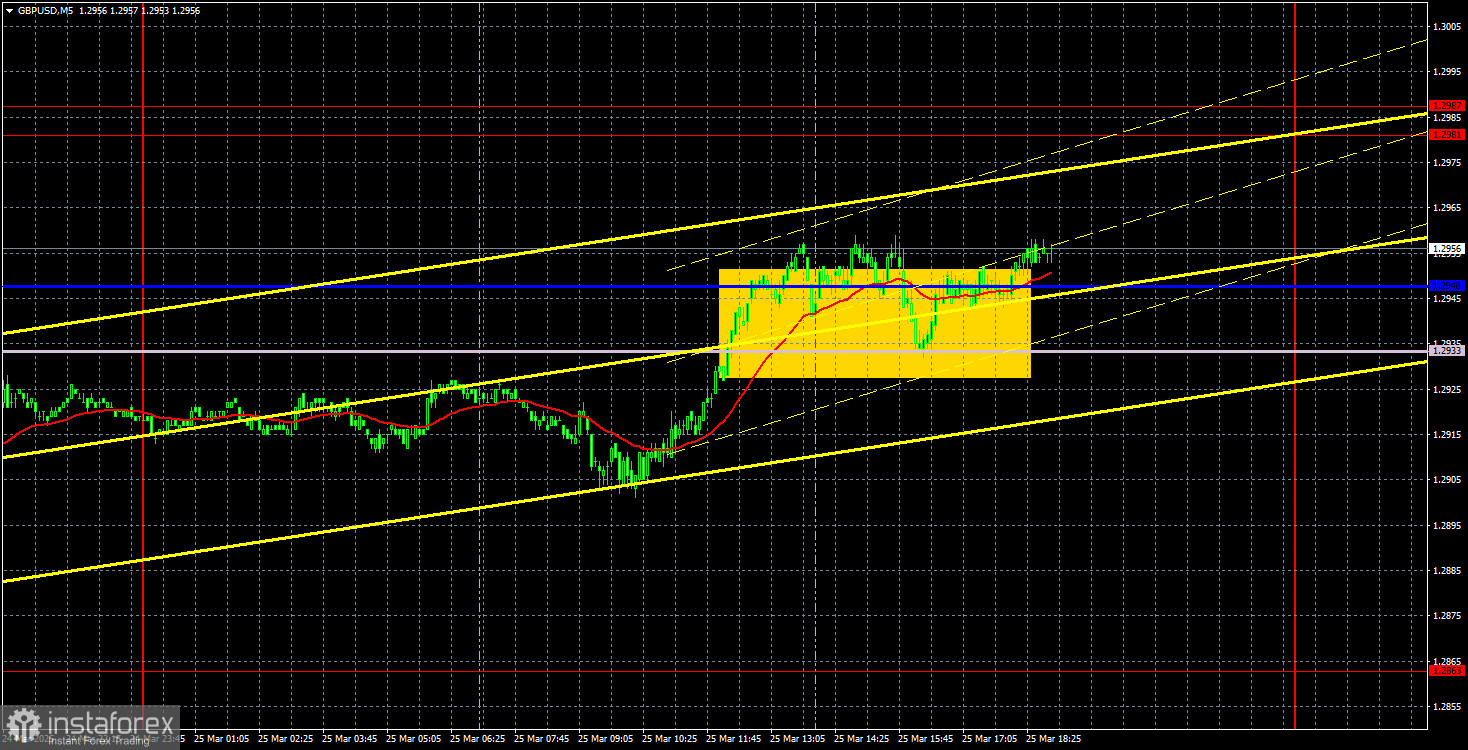
GBP/USD 5-Minute Analysis

This image is no longer relevant

The GBP/USD currency pair showed growth again on Tuesday. "Again," because recently, all movements of the British currency resemble a "swing" or a "roller coaster" – first up, then down. Moreover, it can't even be said that the pair is trading in a flat or sideways channel. On the hourly timeframe, it's clear this is not the case. The direction of movement changes constantly, and the size of the moves is roughly the same.

There were no significant events in the UK on Tuesday, while in the US, the only report was on new home sales. It's safe to say that the British pound appreciated once again without any real reason. But this no longer comes as a surprise, because this is precisely what "swings" are about – up and down movement without solid justification. So yesterday the pound rose for no reason, and today it may just as easily fall.

At the moment, the price is ignoring the Ichimoku indicator lines, which is another sign of a range-like structure that, in fact, is not truly a flat market. Movements are currently far from ideal, while different timeframes and the fundamental, political, and macroeconomic backdrop point in various directions, offering conflicting forecasts.

Formally, on the 5-minute chart, a buy signal was generated yesterday. Once again, the price technically broke through the Kijun-sen and Senkou Span B lines, but such breakouts are not ones we would recommend trading. Especially when you're aware of the ongoing "swings" or pseudo-flat market conditions.
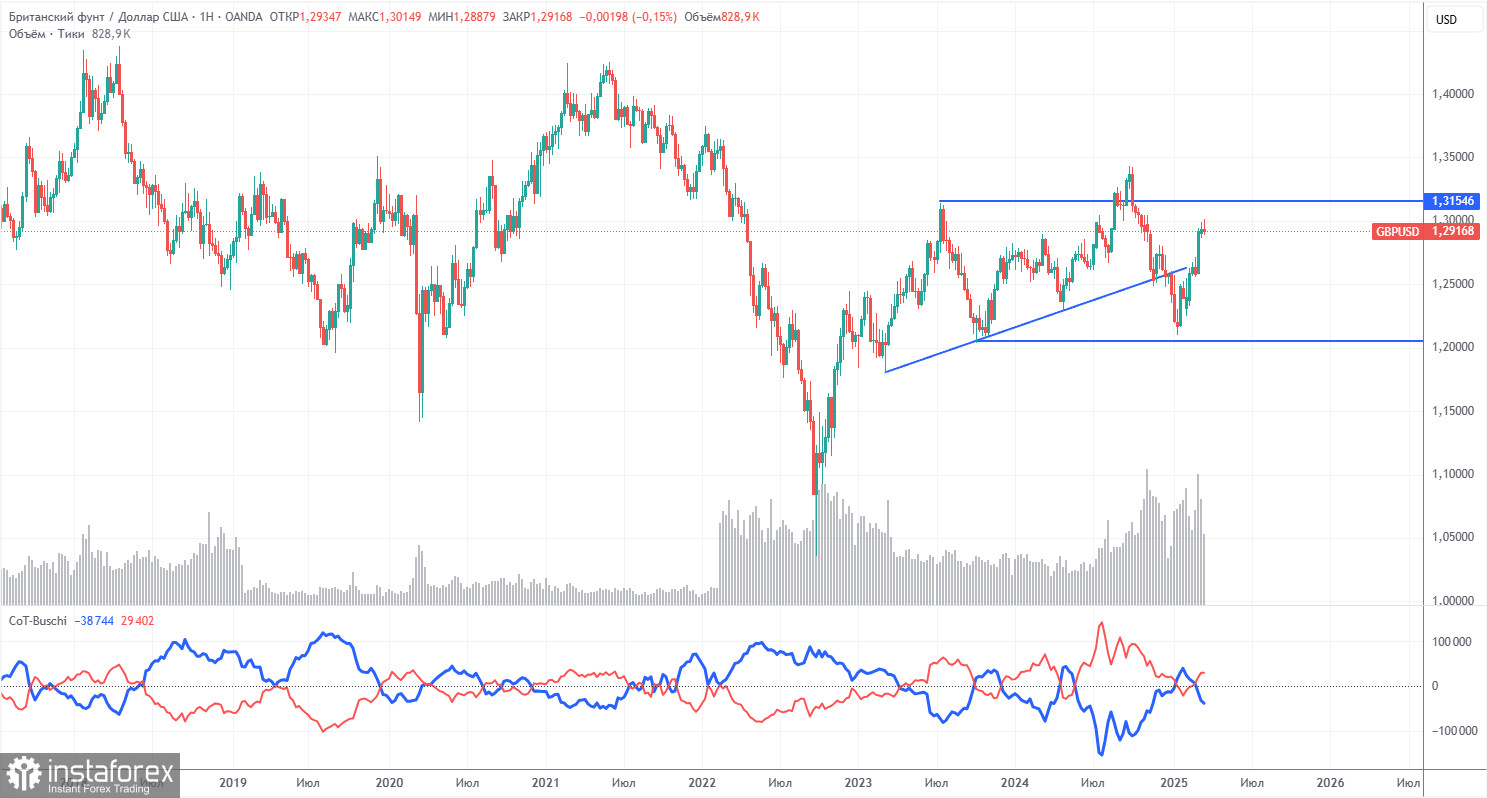
COT Report

This image is no longer relevant

COT reports on the British pound show that commercial traders' sentiment has constantly changed in recent years. The red and blue lines, representing the net positions of commercial and non-commercial traders, intersect frequently and are mainly close to the zero level. They are also near each other, indicating that the number of long and short positions is roughly equal.

On the weekly chart, the price first broke the 1.3154 level and then dropped to the trendline, which it successfully breached. Breaking the trendline suggests that the pound is likely to continue falling. However, we should note a rebound from the second-to-last local low on the weekly chart. We may be dealing with a flat market.

According to the latest COT report on the British pound, the "Non-commercial" group opened 1,100 buy contracts and 900 sell contracts. As a result, the net position of non-commercial traders saw little change over the week.

The current fundamental backdrop does not support long-term buying of the pound, and the currency has a real possibility of continuing its global downward trend. The recent sharp increase in the pound's value can be attributed solely to Donald Trump's policies.

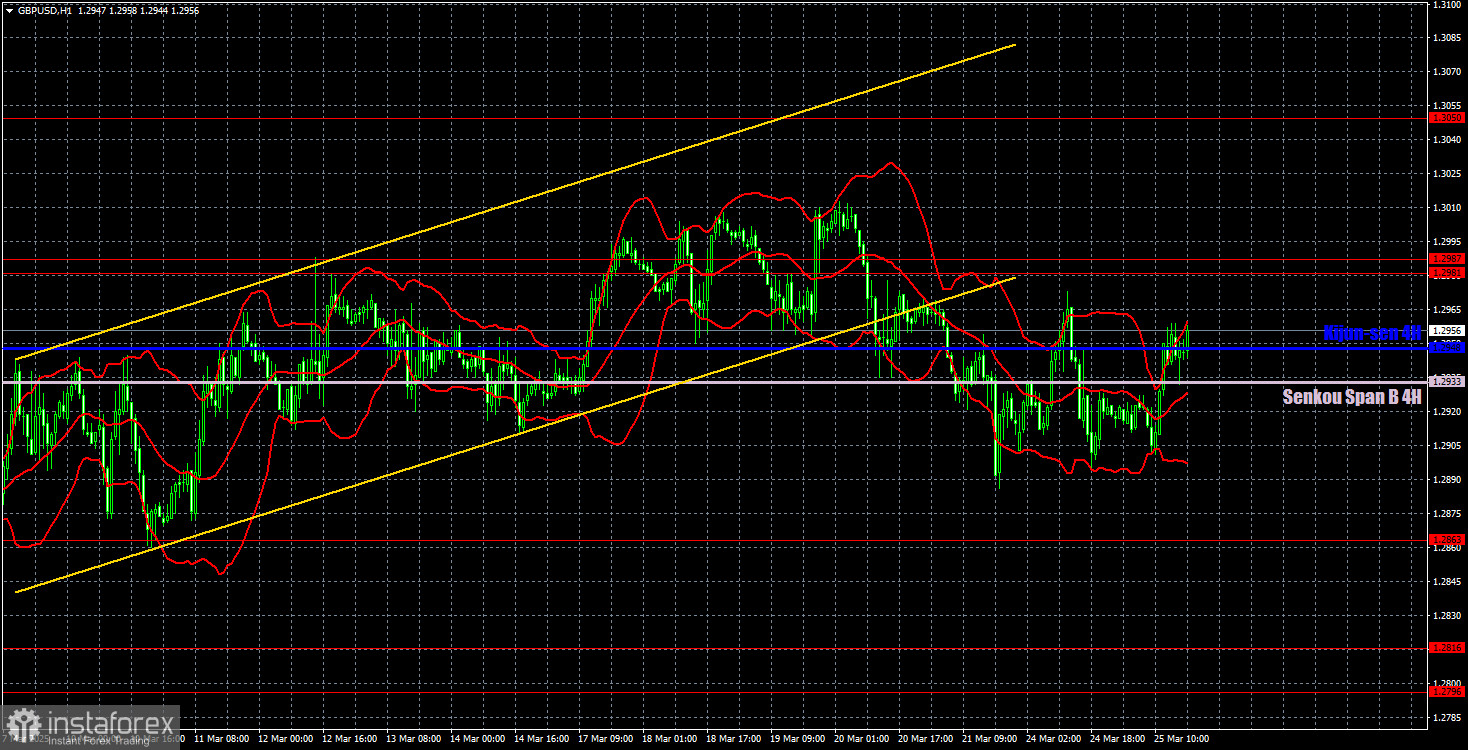
GBP/USD 1-Hour Analysis

This image is no longer relevant

On the hourly timeframe, the GBP/USD pair has initiated a downtrend, but the decline so far is very mild. The upward correction on the daily chart has long been due to end. We still don't see any real basis for sterling to rise in the long term. Right now, the only thing working in favor of the pound is Donald Trump, who is introducing sanctions and tariffs left and right. All other factors are being ignored by the market. The pound hasn't even managed to properly correct after a 650-pip rally.

For March 26, we highlight the following important levels: 1.2331–1.2349, 1.2429–1.2445, 1.2511, 1.2605–1.2620, 1.2691–1.2701, 1.2796–1.2816, 1.2863, 1.2981–1.2987, 1.3050, 1.3119. The Senkou Span B (1.2933) and Kijun-sen (1.2948) lines may also serve as signal sources. It is recommended to set the Stop Loss at breakeven once the price has moved 20 pips in the right direction. The Ichimoku indicator lines may shift throughout the day, which should be taken into account when identifying trading signals.

On Wednesday, the UK will publish its inflation report for February... Why anyone would be interested in February's inflation data at the end of March is unclear. However, this will be the second estimate, which usually matches the first. In the US, a more important report on durable goods orders will be released, but we remind you that macroeconomic statistics currently mean very little to traders.

Illustration Explanations:

  • Support and Resistance Levels (thick red lines): Thick red lines indicate where movement may come to an end. Please note that these lines are not sources of trading signals.
  • Kijun-sen and Senkou Span B Lines: Ichimoku indicator lines transferred from the 4-hour timeframe to the hourly timeframe. These are strong lines.
  • Extreme Levels (thin red lines): Thin red lines where the price has previously bounced. These serve as sources of trading signals.
  • Yellow Lines: Trendlines, trend channels, or any other technical patterns.
  • Indicator 1 on COT Charts: Represents the net position size for each category of traders.
Paolo Greco,
Analytical expert of InstaForex
© 2007-2025
Select timeframe
5
min
15
min
30
min
1
hour
4
hours
1
day
1
week
Earn on cryptocurrency rate changes with InstaForex
Download MetaTrader 4 and open your first trade
  • Grand Choice
    Contest by
    InstaForex
    InstaForex always strives to help you
    fulfill your biggest dreams.
    JOIN CONTEST

Recommended Stories

How to Trade the GBP/USD Pair on May 16? Simple Tips and Trade Analysis for Beginners

Analysis of Thursday's Trades 1H Chart of GBP/USD On Thursday, the GBP/USD pair showed minimal upward movement; however, the 5-minute timeframe indicates this was largely a sideways move

Paolo Greco 06:17 2025-05-16 UTC+2

How to Trade the EUR/USD Pair on May 16? Simple Tips and Trade Analysis for Beginners

Analysis of Thursday's Trades 1H Chart of EUR/USD The EUR/USD currency pair traded in both directions throughout Thursday. The macroeconomic background was rich, but it had no decisive impact

Paolo Greco 06:17 2025-05-16 UTC+2

Trading Recommendations and Analysis for GBP/USD on May 16: The Pound Decided to Take a Break

On Thursday, the GBP/USD currency pair traded strictly sideways with low volatility. Despite a busy macroeconomic calendar, the market ignored most of the data, just as anticipated

Paolo Greco 03:54 2025-05-16 UTC+2

Trading Recommendations and Analysis for EUR/USD on May 16: The Market Has Once Again Confirmed the Obvious

On Thursday, the EUR/USD currency pair showed only one thing—a complete unwillingness to move. We observed sideways movement throughout the day despite a fairly packed macroeconomic calendar. However, as mentioned

Paolo Greco 03:54 2025-05-16 UTC+2

How to Trade the GBP/USD Pair on May 15? Simple Tips and Trade Analysis for Beginners

Analysis of Wednesday's Trades 1H Chart of GBP/USD The GBP/USD pair continued its upward movement throughout Wednesday, despite the absence of any specific fundamental reasons. The day before, a U.S

Paolo Greco 06:21 2025-05-15 UTC+2

How to Trade the EUR/USD Pair on May 15? Simple Tips and Trade Analysis for Beginners

Analysis of Wednesday's Trades 1H Chart of EUR/USD The EUR/USD currency pair experienced upward movement for approximately half of Wednesday. The latest "surge" in the euro was particularly "impressive," although

Paolo Greco 06:21 2025-05-15 UTC+2

Trading Recommendations and Analysis for GBP/USD on May 15: The Roller Coaster Begins

On Wednesday, the GBP/USD currency pair continued trading with an upward bias for some time, but it resumed its decline in the afternoon. From our perspective, the U.S. dollar

Paolo Greco 03:41 2025-05-15 UTC+2

Trading Recommendations and Analysis for EUR/USD on May 15: Heading Down Again or Waiting for Trump?

The EUR/USD currency pair continued upward movement on Wednesday, but only briefly. In the afternoon, the euro started to decline, despite the lack of macroeconomic factors supporting such moves. Donald

Paolo Greco 03:41 2025-05-15 UTC+2

How to Trade the GBP/USD Pair on May 14? Simple Tips and Trade Analysis for Beginners

Analysis of Tuesday's Trades 1H Chart of GBP/USD On Tuesday, the GBP/USD pair experienced significant growth, despite no clear catalyst behind it. On Monday, the dollar rose on specific grounds

Paolo Greco 06:11 2025-05-14 UTC+2

How to Trade the EUR/USD Pair on May 14? Simple Tips and Trade Analysis for Beginners

Analysis of Tuesday's Trades 1H Chart of EUR/USD On Tuesday, the EUR/USD currency pair nearly fully recovered from Monday's decline. As reality has shown, strong reasons are required

Paolo Greco 06:11 2025-05-14 UTC+2
Can't speak right now?
Ask your question in the chat.
Widget callback
 

Dear visitor,

Your IP address shows that you are currently located in the USA. If you are a resident of the United States, you are prohibited from using the services of InstaFintech Group including online trading, online transfers, deposit/withdrawal of funds, etc.

If you think you are seeing this message by mistake and your location is not the US, kindly proceed to the website. Otherwise, you must leave the website in order to comply with government restrictions.

Why does your IP address show your location as the USA?

  • - you are using a VPN provided by a hosting company based in the United States;
  • - your IP does not have proper WHOIS records;
  • - an error occurred in the WHOIS geolocation database.

Please confirm whether you are a US resident or not by clicking the relevant button below. If you choose the wrong option, being a US resident, you will not be able to open an account with InstaForex anyway.

We are sorry for any inconvenience caused by this message.