empty
25.03.2025 07:29 AM
How to Trade the GBP/USD Pair on March 25? Simple Tips and Trade Analysis for Beginners

Analysis of Monday's Trades
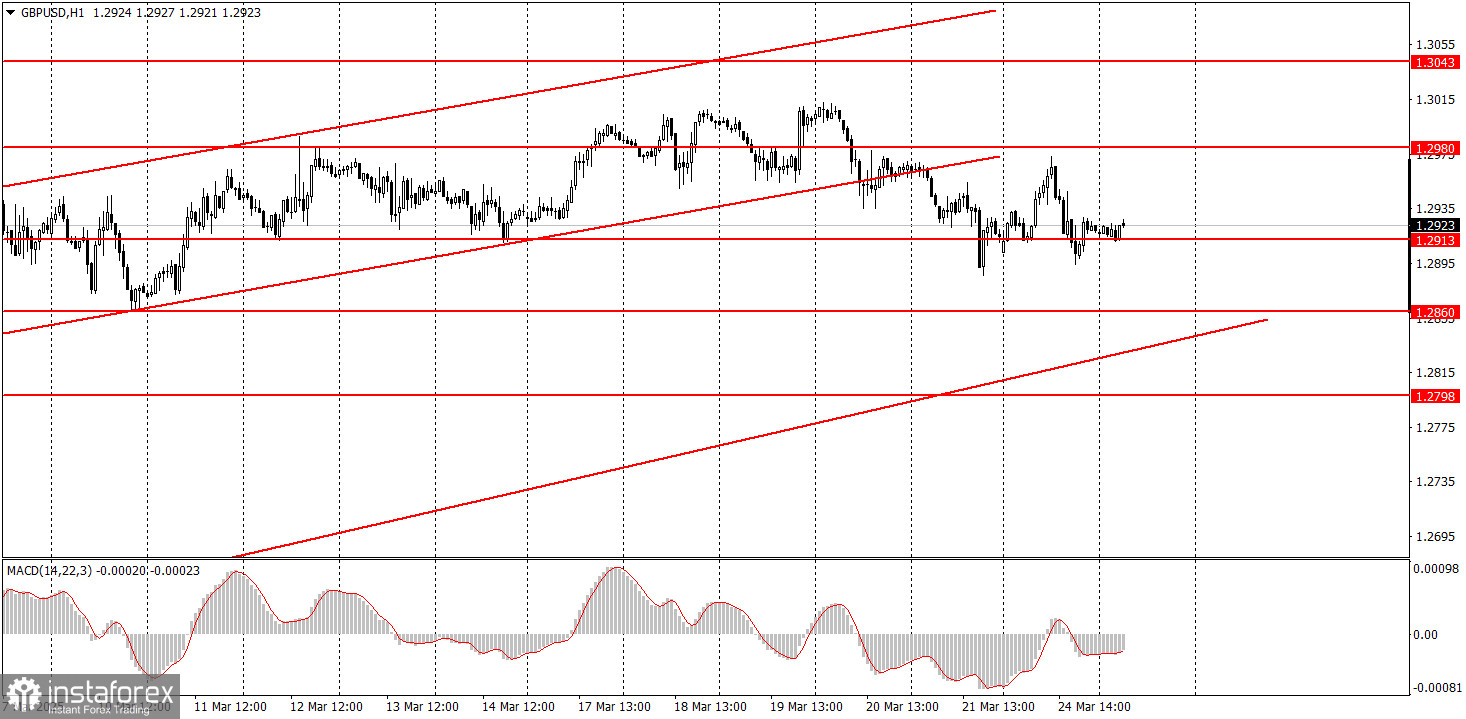
1H Chart of GBP/USD

This image is no longer relevant

The GBP/USD pair traded both up and down on Monday. The uptrend remains intact thanks to the ascending trendline, which has been relevant for over a month—quite a rare occurrence for the hourly timeframe. The price has exited the ascending channel, so a correction toward the trendline is possible. The euro has also entered a corrective phase, so we believe the dollar will strengthen this week. Monday's macroeconomic backdrop was unusually contradictory, as the UK and U.S. business activity indices delivered conflicting signals in terms of character and the relationship between forecasts and actual results. As a result, the U.S. dollar barely gained by the end of the day. The British pound continues to demonstrate impressive resilience against the dollar, largely thanks to the Bank of England, which adopted a more hawkish stance on monetary policy during its latest meeting. Nevertheless, the pair cannot continue rising indefinitely without corrections.
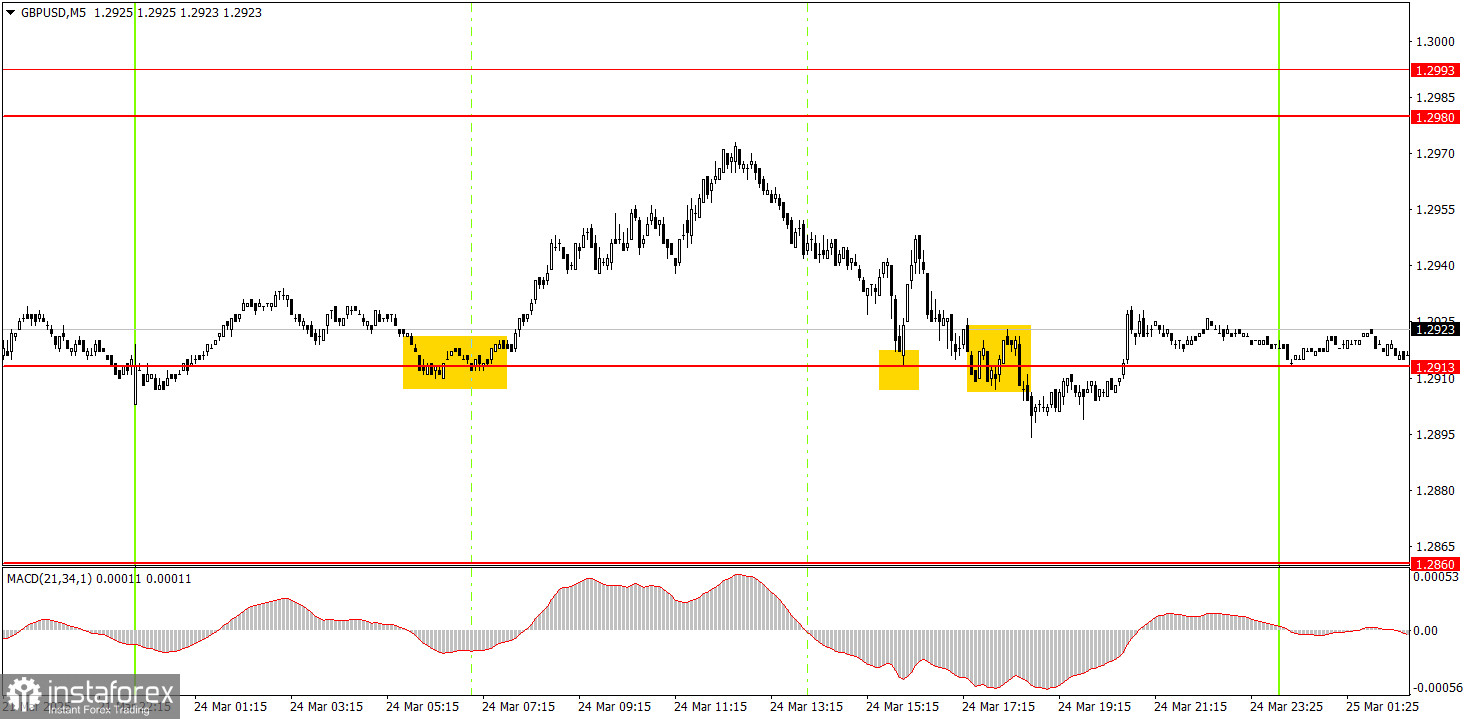
5M Chart of GBP/USD

This image is no longer relevant

On the 5-minute timeframe on Monday, several trading signals were formed. Early in the European session, the price bounced off the 1.2913 level and climbed about 50 pips. Unfortunately, it missed the nearest target level by just seven pips, so the trade couldn't be closed by Take Profit. Then, there was another bounce from 1.2913, followed by a breakout of this level. Technically, all signals were false since the target levels weren't reached. However, no losses were possible, as the price moved at least 20 pips in the correct direction each time. It was best to ignore the third signal.

Trading Strategy for Tuesday:

The GBP/USD pair should have already begun a downtrend on the hourly timeframe, but Trump is doing everything to prevent that. In the medium term, we still expect the pound to decline toward 1.1800, but it's unclear how much longer the dollar's "Trump-induced" plunge will last. Once that move ends, the technical picture on all timeframes may change drastically, but long-term trends still point south. The pound has risen for a reason, but again, far too strongly and irrationally.

On Tuesday, GBP/USD may continue declining, as the technical setup of the hourly timeframe supports this view. The pound is once again overbought and unjustifiably expensive.

On the 5-minute chart, the following levels are relevant for trading: 1.2301, 1.2372–1.2387, 1.2445, 1.2502–1.2508, 1.2547, 1.2613, 1.2680–1.2685, 1.2723, 1.2791–1.2798, 1.2848–1.2860, 1.2913, 1.2980–1.2993, 1.3043, 1.3102–1.3107. No important events or reports are scheduled in the UK on Tuesday, and the only release in the U.S. is the new home sales report. Therefore, macroeconomic influence on the pair's movement will be minimal today.

Core Trading System Rules:

  1. Signal Strength: The shorter the time it takes for a signal to form (a rebound or breakout), the stronger the signal.
  2. False Signals: If two or more trades near a level result in false signals, subsequent signals from that level should be ignored.
  3. Flat Markets: In flat conditions, pairs may generate many false signals or none at all. It's better to stop trading at the first signs of a flat market.
  4. Trading Hours: Open trades between the start of the European session and the middle of the US session, then manually close all trades.
  5. MACD Signals: On the hourly timeframe, trade MACD signals only during periods of good volatility and a clear trend confirmed by trendlines or trend channels.
  6. Close Levels: If two levels are too close (5–20 pips apart), treat them as a support or resistance zone.
  7. Stop Loss: Set a Stop Loss to breakeven after the price moves 20 pips in the desired direction.

Key Chart Elements:

Support and Resistance Levels: These are target levels for opening or closing positions and can also serve as points for placing Take Profit orders.

Red Lines: Channels or trendlines indicating the current trend and the preferred direction for trading.

MACD Indicator (14,22,3): A histogram and signal line used as a supplementary source of trading signals.

Important Events and Reports: Found in the economic calendar, these can heavily influence price movements. Exercise caution or exit the market during their release to avoid sharp reversals.

Forex trading beginners should remember that not every trade will be profitable. Developing a clear strategy and practicing proper money management are essential for long-term trading success.

Paolo Greco,
Analytical expert of InstaForex
© 2007-2025
Select timeframe
5
min
15
min
30
min
1
hour
4
hours
1
day
1
week
Earn on cryptocurrency rate changes with InstaForex
Download MetaTrader 4 and open your first trade
  • Grand Choice
    Contest by
    InstaForex
    InstaForex always strives to help you
    fulfill your biggest dreams.
    JOIN CONTEST

Recommended Stories

How to Trade the GBP/USD Pair on May 8? Simple Tips and Trade Analysis for Beginners

Analysis of Wednesday's Trades 1H Chart of GBP/USD The GBP/USD pair showed no notable movements on Wednesday. After Jerome Powell stated the need for more time to assess the full

Paolo Greco 06:05 2025-05-08 UTC+2

How to Trade the EUR/USD Pair on May 8? Simple Tips and Trade Analysis for Beginners

Analysis of Wednesday's Trades 1H Chart of EUR/USD The EUR/USD currency pair continued to trade within the sideways channel on Wednesday, which is visible on the hourly timeframe

Paolo Greco 06:05 2025-05-08 UTC+2

Trading Recommendations and Analysis for GBP/USD on May 8: The Pound Sees No Reason to Panic

On Wednesday, the GBP/USD currency pair continued trading within a sideways channel, clearly visible on the hourly timeframe. There was virtually no movement throughout the day, and no fundamental

Paolo Greco 04:19 2025-05-08 UTC+2

Trading Recommendations and Analysis for EUR/USD on May 8: All the Excitement Is Behind Us

On Wednesday, the EUR/USD currency pair continued to trade in the same flat range. The 1.1274 and 1.1426 levels bound the broader sideways channel, while the narrower channel ranges between

Paolo Greco 04:18 2025-05-08 UTC+2

GBP/USD: Trading Plan for the U.S. Session on May 7th (Review of Morning Trades)

In my morning forecast, I focused on the 1.3335 level and planned to base entry decisions around it. Let's look at the 5-minute chart and see what happened. A breakout

Miroslaw Bawulski 19:39 2025-05-07 UTC+2

EUR/USD: Trading Plan for the U.S. Session on May 7th (Review of Morning Trades)

In my morning forecast, I highlighted the 1.1379 level and planned to base market entry decisions around it. Let's look at the 5-minute chart to understand what happened. A rise

Miroslaw Bawulski 19:36 2025-05-07 UTC+2

How to Trade the GBP/USD Pair on May 7? Simple Tips and Trade Analysis for Beginners

Analysis of Tuesday's Trades 1H Chart of GBP/USD The GBP/USD pair exhibited a notable upward movement on Tuesday, although it remains within a sideways channel that may not be immediately

Paolo Greco 06:55 2025-05-07 UTC+2

How to Trade the EUR/USD Pair on May 7? Simple Tips and Trade Analysis for Beginners

Analysis of Tuesday's Trades 1H Chart of EUR/USD On Tuesday, the EUR/USD currency pair traded completely flat. Throughout the day, there were no significant reports or events either

Paolo Greco 06:55 2025-05-07 UTC+2

Trading Recommendations and Analysis for GBP/USD on May 7: The Pound Isn't Wasting Time

On Tuesday, the GBP/USD currency pair suddenly and unexpectedly resumed upward movement. While the euro was stuck in a flat market, the British pound showed a strong rally, and again

Paolo Greco 03:35 2025-05-07 UTC+2

Trading Recommendations and Analysis for EUR/USD on May 7: The Market Remains Stagnant

The EUR/USD currency pair continued to trade in the same sideways range on Tuesday — a flat within a flat. The broader sideways channel is bounded by the levels 1.1274

Paolo Greco 03:35 2025-05-07 UTC+2
Can't speak right now?
Ask your question in the chat.
Widget callback
 

Dear visitor,

Your IP address shows that you are currently located in the USA. If you are a resident of the United States, you are prohibited from using the services of InstaFintech Group including online trading, online transfers, deposit/withdrawal of funds, etc.

If you think you are seeing this message by mistake and your location is not the US, kindly proceed to the website. Otherwise, you must leave the website in order to comply with government restrictions.

Why does your IP address show your location as the USA?

  • - you are using a VPN provided by a hosting company based in the United States;
  • - your IP does not have proper WHOIS records;
  • - an error occurred in the WHOIS geolocation database.

Please confirm whether you are a US resident or not by clicking the relevant button below. If you choose the wrong option, being a US resident, you will not be able to open an account with InstaForex anyway.

We are sorry for any inconvenience caused by this message.