empty
20.11.2024 10:13 AM
EUR/USD and GBP/USD on November 20 – Technical Analysis

EUR/USD

This image is no longer relevant

Higher Timeframes:

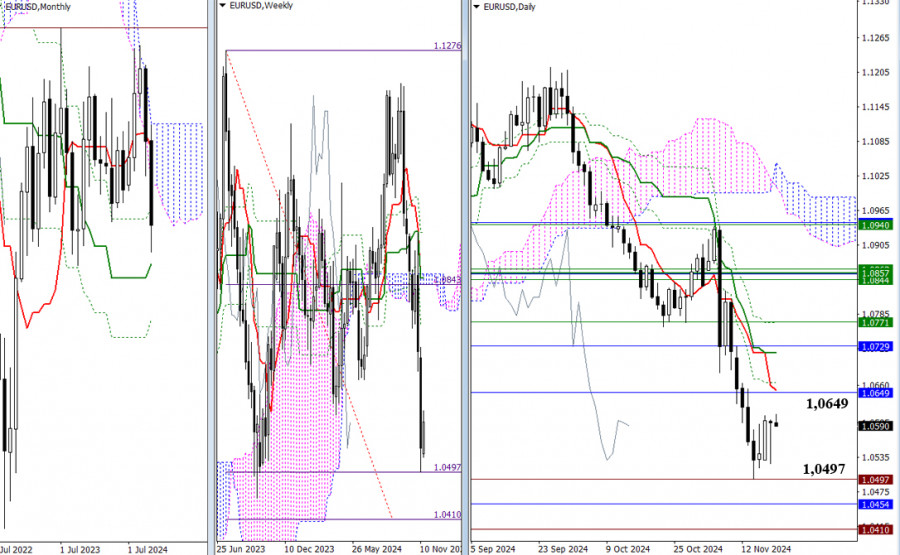
After testing the support at the first weekly Ichimoku breakout target (1.0497), the pair slowed down and entered a consolidation phase. Key downside targets such as the weekly goal (1.0497 – 1.0410) and the monthly mid-term trend support (1.0454) remain intact. If the pair exits the consolidation zone to the upside, market interest will likely shift to the resistance zone at 1.0649 – 1.0729 – 1.0771, where levels from different timeframes converge.

This image is no longer relevant

H4 – H1:

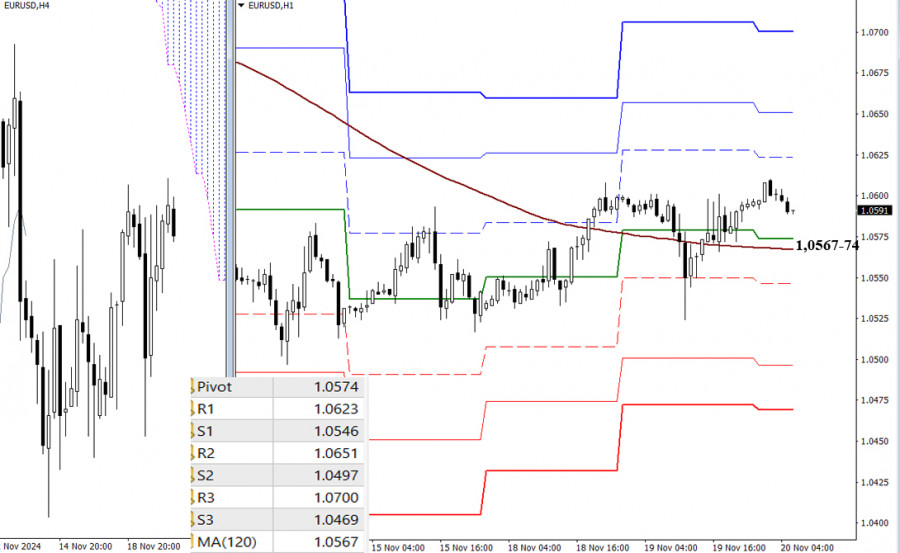
On the lower timeframes, the pair has consolidated above the key levels at 1.0567-74 (weekly long-term trend + central daily Pivot level), giving the bulls the upper hand. Intraday bullish targets include classic Pivot resistance levels (1.0623 – 1.0651 – 1.0700).

However, if the market loses these key supports (1.0567 – 1.0574), bears will regain control and aim for classic Pivot supports (1.0546 – 1.0497 – 1.0469).

***

GBP/USD

This image is no longer relevant

Higher Timeframes:

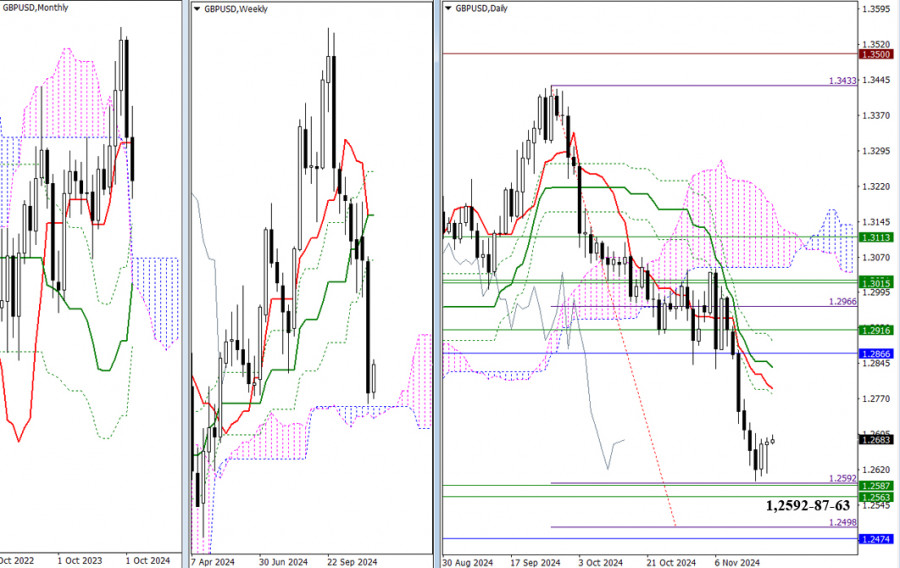
Recently, the pound neared a strong support zone, which includes the daily Ichimoku breakout target (1.2592 – 1.2498), the weekly Ichimoku cloud (1.2563 – 1.2587), and the monthly support (1.2474). These levels have slowed the downtrend, giving the bears a pause. If this slowdown becomes a correction, the market will first encounter daily Ichimoku cross resistances (1.2792 – 1.2836) and the monthly short-term trend (1.2866).

This image is no longer relevant

H4 – H1:

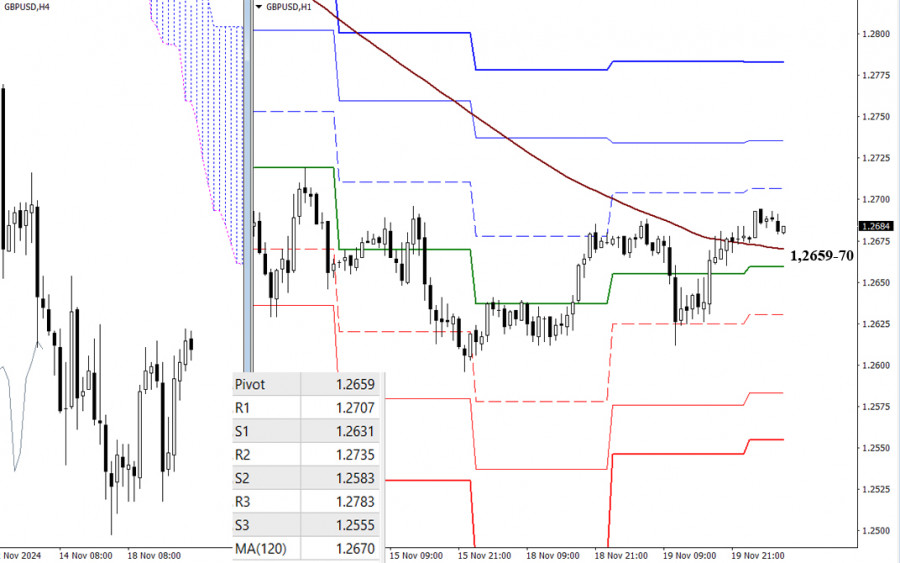
In the lower timeframes, the pair moved above the key levels at 1.2659-70 (central daily Pivot + weekly long-term trend), providing the bulls an advantage. Intraday bullish targets lie at classic Pivot resistance levels (1.2707 – 1.2735 – 1.2783).

If the trend reverses again and the pair moves below the key levels, bearish momentum may develop. Intraday downside targets include classic Pivot supports at 1.2631 – 1.2583 – 1.2555.


Indicators Used:

  • Higher Timeframes: Ichimoku Kinko Hyo (9.26.52) + Fibo Kijun levels
  • Lower Timeframes (H1): Classic Pivot Points + Moving Average 120 (weekly long-term trend).
Evangelos Poulakis,
ইন্সটাফরেক্সের বিশ্লেষণ বিশেষজ্ঞ
© 2007-2025
টাইমফ্রেম নির্বাচন করুন
5
মিনিট
15
মিনিট
30
মিনিট
1
ঘন্টা
4
ঘন্টা
1
দিন
1
সপ্তাহ
ইনস্টাফরেক্স দিয়ে ক্রিপ্টোমুদ্রা দর পরিবর্তনে আয় করুন।
মেটাট্রেডার 4 ডাউনলোড করে আপনার প্রথম ট্রেড চালু করুন।
  • Grand Choice
    Contest by
    InstaForex
    InstaForex always strives to help you
    fulfill your biggest dreams.
    প্রতিযোগীতায় অংশগ্রহণ করুন

সুপারিশকৃত নিবন্ধ

বিটকয়েনের পূর্বাভাস – ১২ ফেব্রুয়ারি, ২০২৫

দৈনিক চার্টে, বিটকয়েনের মূল্য ব্যালেন্স সূচক লাইনের (লাল রঙ দ্বারা চিহ্নিত মুভিং এভারেজ) উপরে উঠতে লড়াই করছে, যা নির্দেশ করে যে মার্কেটের ট্রেডাররা বিটকয়েন বিক্রির দিকে মনোযোগ দিচ্ছে। মার্লিন অসিলেটরের

Laurie Bailey 08:55 2025-02-12 UTC+2

তেলের পূর্বাভাস - ১০ ফেব্রুয়ারি ২০২৫

সাপ্তাহিক চার্টে, মূল্য সাময়িকভাবে MACD সূচকের লাইনটির নিচে নেমে গিয়েছিল, তবে দ্রুতই পুনরুদ্ধার ঘটেছে। নতুন সপ্তাহের শুরুতে মূল্য এই লাইনের উপরে থাকা অবস্থায় ট্রেডিং শুরু হয়েছে, এবং এখন মূল্য 71.44

Laurie Bailey 07:03 2025-02-10 UTC+2

গোল্ডের (XAU/USD) ট্রেডিং সিগন্যাল, ২৯-৩১ জানুয়ারি, ২০২৫: গোল্ডের মূল্য $2,765 (21 SMA - 7/8 মারে)-এর নিচে থাকা অবস্থায় এটি বিক্রি করুন

মার্কিন সেশনের শুরুতে, গোল্ড $2,758 এর আশেপাশে ট্রেড করছে, যা 7/8 মারে-এর নিচে এবং জানুয়ারির শুরু থেকে গঠিত আপট্রেন্ড চ্যানেলের মধ্যে রয়েছে। গোল্ডের দরপতনের লক্ষণ দেখা যাচ্ছে। তাই, পরবর্তী কয়েক

Dimitrios Zappas 14:25 2025-01-29 UTC+2

EUR/USD-এর পূর্বাভাস, ২৯ জানুয়ারি, ২০২৫

গতকালকের সেশনের শেষের দিকে, EUR/USD পেয়ারের মূল্য দৈনিক চার্টে ব্যালেন্স ইন্ডিকেটর লাইনের নিচে নেমে গেছে। এটি এই ইঙ্গিত দেয় যে 1.0520 লেভেলের দিকে মূল্য বৃদ্ধি হয়তো একটি ভুল ব্রেকআউট ছিল

Laurie Bailey 07:29 2025-01-29 UTC+2

GBP/USD-এর পূর্বাভাস, ২৯ জানুয়ারি, ২০২৫

গতকাল ব্রিটিশ পাউন্ডের 55 পিপস দরপতন হয়েছে এবং এটির মূল্য দৈনিক MACD লাইনের (নীল লাইন) নিচে স্থিতিশীল হয়েছে। এখন মূল্য 1.2367 এর সাপোর্ট লেভেল টেস্ট করার প্রস্তুতি নিচ্ছে। আজ FOMC-এর

Laurie Bailey 07:23 2025-01-29 UTC+2

সিলভারের পূর্বাভাস, ২৯ জানুয়ারি, ২০২৫

সাপ্তাহিক চার্টে, সিলভারের মূল্য দৃঢ়ভাবে MACD ইন্ডিকেটর লাইনের উপরে অবস্থান করছে, যেখানে সাপ্তাহিক ক্যান্ডলস্টিকগুলোর বডি সম্পূর্ণরূপে এই লাইনের উপরে রয়েছে। একমাত্র বাধা হলো ব্যালেন্স লাইন। তবে, সিলভারের মূল্য ব্রেকআউটের চেষ্টা

Laurie Bailey 07:16 2025-01-29 UTC+2

বিটকয়েনের পূর্বাভাস, ২৯ জানুয়ারি, ২০২৫

সাপ্তাহিক চার্টে, বিটকয়েনের মূল্যের সাথে মার্লিন অসসিলেটরের মধ্যে একটি স্পষ্ট ডাইভারজেন্স রয়েছে। এই ডাইভারজেন্সের যথেষ্ট সম্ভাবনা রয়েছে; এটি যদি সম্পূর্ণ বিপরীতমুখী প্রবণতা সৃষ্টি না করে, তাহলে অন্তত ২ থেকে

Laurie Bailey 06:47 2025-01-29 UTC+2

EUR/JPY: ইসিবির সুদের হার হ্রাসের সিদ্ধান্ত এই পেয়ারের উপর চাপ সৃষ্টি করতে পারে

পশ্চিমা বিশ্বের সমর্থনে ইউক্রেন ভূখণ্ডে রাশিয়ার সঙ্গে দেশটির চলমান সংঘাত এবং ইউরোপে অব্যাহত অর্থনৈতিক মন্দার কারণে সম্ভবত ইউরোপীয় কেন্দ্রীয় ব্যাংক (ইসিবি) অঞ্চলটির অর্থনৈতিক ক্ষতি লাঘব করতে সুদের হার হ্রাসের সিদ্ধান্ত

Pati Gani 12:13 2025-01-24 UTC+2

USD/JPY পেয়ারের পূর্বাভাস, ১৪ জানুয়ারি, ২০২৫

শুক্রবার একটি ফলস ব্রেকআউটের পর USD/JPY পেয়ারের মূল্য দ্রুত 159.32 লেভেলের নিচে নেমে গিয়েছে। যদিও মূল্য এই লেভেলের উপরে ওঠার চেষ্টা করছে, কিন্তু এই পেয়ারের মূল্যের মুভমেন্ট দৈনিক চার্টে ইতোমধ্যে

Laurie Bailey 07:23 2025-01-14 UTC+2

স্বর্ণের (XAU/USD) ট্রেডিং সিগন্যাল, ২-৫ জানুয়ারী, ২০২৫: মূল্য $2,640 (21 SMA - 4/8 মারে) এর উপরে থাকা অবস্থায় স্বর্ণ কিনুন

ইগল সূচক ওভারবট সিগন্যাল দেখাচ্ছে। সুতরাং, আমরা বিশ্বাস করি যে একবার এই ইনস্ট্রুমেন্টটির মূল্য 2,656 লেভেলের নিচে স্থিতিশীল হলে, এটি বিক্রয়ের জন্য একটি সুযোগ হিসাবে দেখা হবে। যদি স্বর্ণের মূল্য

Dimitrios Zappas 07:51 2025-01-03 UTC+2
এখন কথা বলতে পারবেন না?
আপনার প্রশ্ন জিজ্ঞাসা করুন চ্যাট.
Widget callback
 

Dear visitor,

Your IP address shows that you are currently located in the USA. If you are a resident of the United States, you are prohibited from using the services of InstaFintech Group including online trading, online transfers, deposit/withdrawal of funds, etc.

If you think you are seeing this message by mistake and your location is not the US, kindly proceed to the website. Otherwise, you must leave the website in order to comply with government restrictions.

Why does your IP address show your location as the USA?

  • - you are using a VPN provided by a hosting company based in the United States;
  • - your IP does not have proper WHOIS records;
  • - an error occurred in the WHOIS geolocation database.

Please confirm whether you are a US resident or not by clicking the relevant button below. If you choose the wrong option, being a US resident, you will not be able to open an account with InstaForex anyway.

We are sorry for any inconvenience caused by this message.